2011 First Quarter
Consistency in ECI signals steady (albeit gentle) currents in U.S. labor market waters
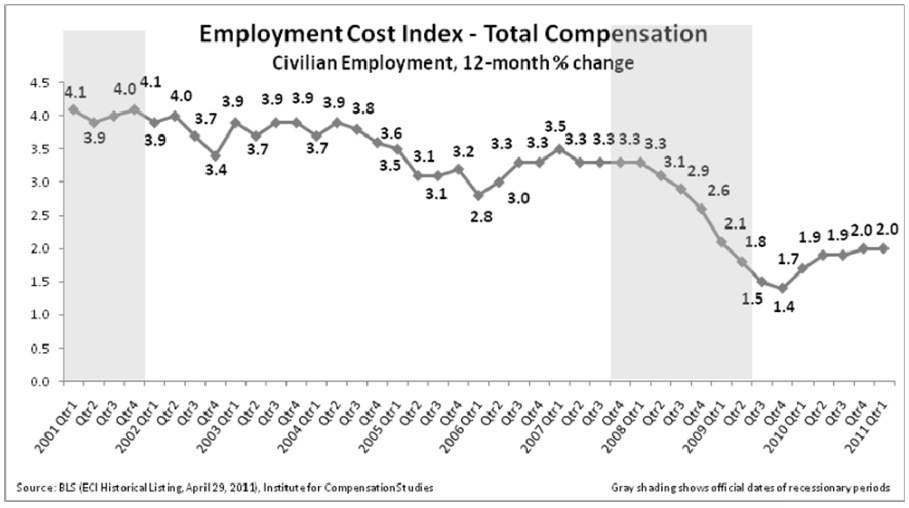
The change in employer spending for the 12 months ending March 2011 on wages, salaries, and benefits across the civilian U.S. labor force, remains roughly even with the past three quarterly reports of year-on-year changes. According to the Employment Cost Index released Friday April 29, 2011 by the U.S. Bureau of Labor Statistics, compensation costs to civilian employers are 2.0 percent higher than they were a year ago.1
Seasonally adjusted, compensation costs increased 0.6 percent for the 3-month period ending March 2011. This is up from 0.4 percent reported for the previous quarter’s 3-month increase for the period ending December 2010.
This is identical to last quarter’s 12-month ECI and only slightly higher than 1.9 percent year-on-year increase reported for the prior two quarters (spanning the two 12-month periods ending September 2010 and June 2010).
Federal monetary policy makers appear to expect this consistent growth in compensation costs to employers to hold (i.e. no rapid acceleration in pay and benefits). In his press conference two days before this quarter’s ECI release, Federal Reserve Chairman Ben Bernanke stated that “If households and firms continue to expect” current price increases to be temporary, “then increased commodity prices are unlikely to induce significant second-round effects in which inflation takes hold in non-commodity prices and in nominal wages.”2
Ben Bernanke Press Conference Live Stream, minutes 12:00-12:19. As accessed on 4/29/11 from “Ben Bernanke Press Conference Live Streaming,” MyBankTrackerTM, http://www.mybanktracker.com/bank-news/2011/04/27/ben-bernanke-press-conference-live-streaming/ The April 27 press conference was the first ever scheduled news conference by a Federal Reserve Chairman following an open-market committee meeting.
In other words, the Chairman anticipates no rapid increase in wage and salary costs to employers.
Compensation increases versus price increases
Chairman Bernanke characterized the current price pressures as “transitory” because underlying forces on inflation are “subdued” and “slack in labor market” continues.3
Ben Bernanke Press Conference Live Stream. See minutes 9:15 and 11:12. As accessed on 4/29/11 from “Ben Bernanke Press Conference Live Streaming,” MyBankTrackerTM, http://www.mybanktracker.com/bank- news/2011/04/27/ben-bernanke-press-conference-live-streaming/
However, there is little comfort in this analysis for U.S. employees.
Daily living costs of American workers are rising, gasoline and food costs in particular, while slack labor market conditions translate into downward pressure on wage and salary increases. Employers should consider the possibility that their employees may feel less satisfied than anticipated with pay increases determined in last year’s lower inflation environment.
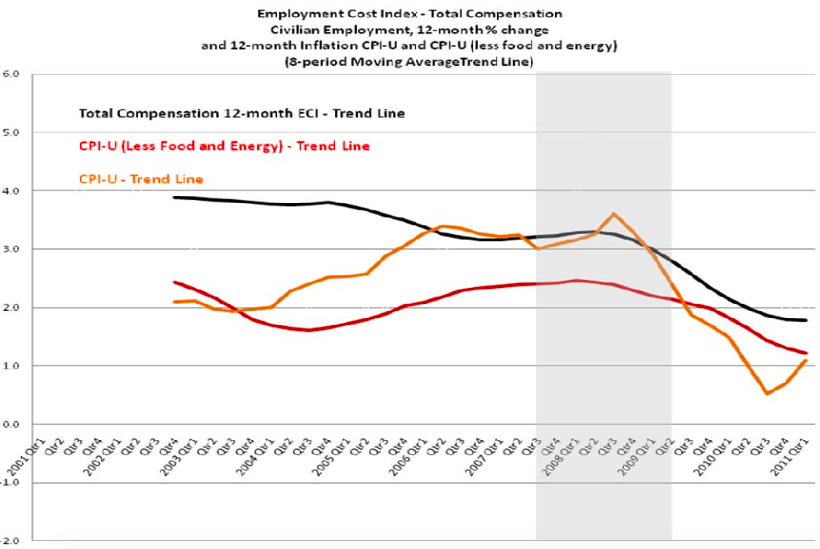
Gray shading shows official dates of recessionary periods.
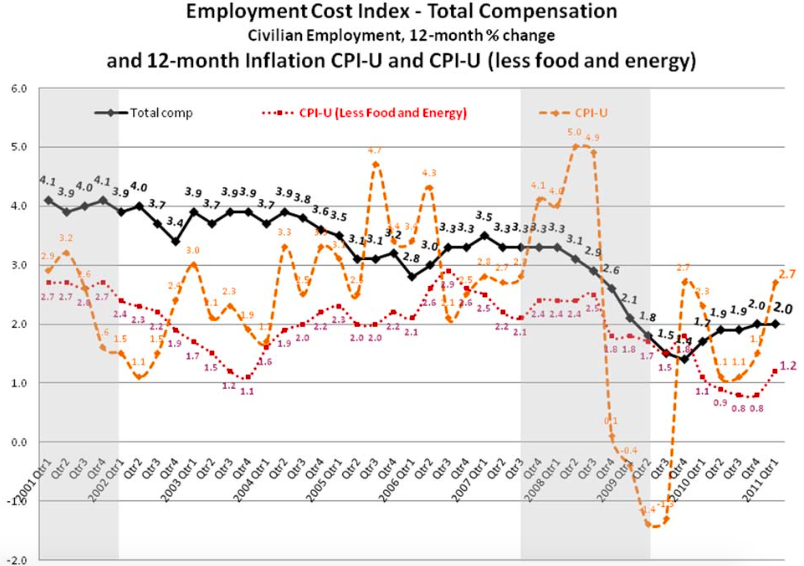
Food and energy prices are notoriously volatile. The Consumer Price Index for All Urban Consumers (CPI-U) increased 2.7 percent over the last 12 months. When food and energy are removed from this calculation, inflation for the 12 months ending March 2011 drops to 1.2 percent.4
See U.S. Bureau Labor Statistics, News Release, Consumer Price Index - March 2011, USDL-11-0513, April 15, 2011 http://www.bls.gov/news.release/pdf/cpi.pdf, downloaded 4/29/11.
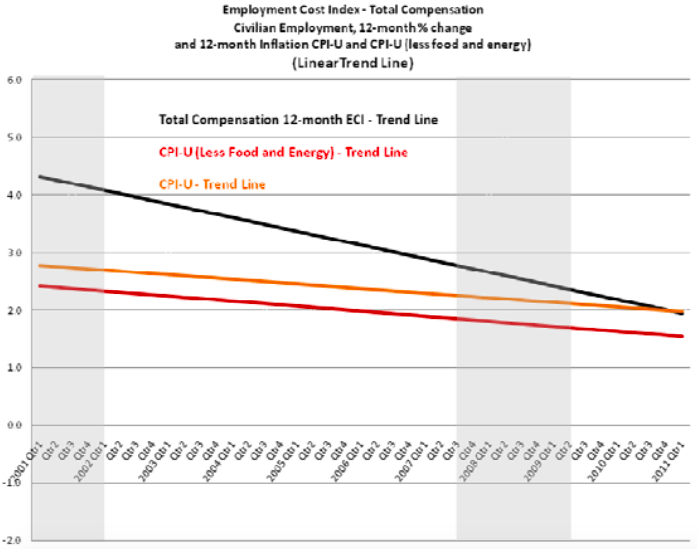
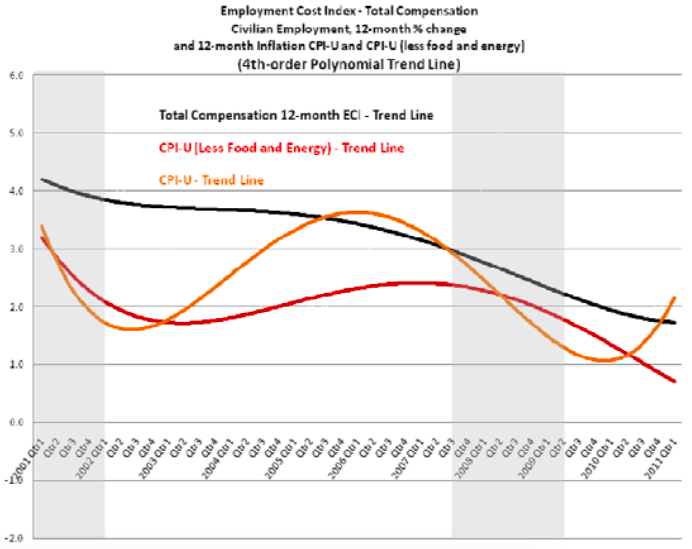
Graphing inflation with and without food and energy prices against the 12-month total compensation ECI helps to illustrate the large role energy and food costs are playing in price pressures felt by the bulk of U.S. households. Smoothing the quarterly data more clearly reveals the “transitory” nature of the bump to inflation from food and energy prices and the multi-year downward trend in the growth of prices and compensation. This smoothing can be done in various degrees.
In the three variations presented below, the gap between the 12-month ECI and the 12-month CPI-U with and without food and energy shrinks by varying degrees.
Gray shading shows official dates of recessionary periods.
Gray shading shows official dates of recessionary periods.
Gray shading shows official dates of recessionary periods.
Wage and salary costs vs. benefits
Employees recognize most directly compensation in the form of wages and salaries as rewards from their employers for the work they do. While employers are gently accelerating their spending on employee benefits, increases to wage and salary costs are holding steady.5
In December 2010, wages and salaries accounted for 70.8 percent of total employee compensation, while benefits accounted for the remaining 29.2 percent. Data for March 2011 is scheduled for release on June 8, 2011, at 10:00 a.m. (EDT). See U.S. Bureau Labor Statistics, News Release, Employer Costs for Employee Compensation news release text, USDL-11-0304, March 9, 2011, http://www.bls.gov/news.release/ecec.nr0.htm, downloaded 4/29/11.
Over the 12 months ending March 2011, what employers (private and state and local governments) spent on employee benefits is up 3 percent—this is slightly higher again than the 2.9 percent more for the 12 months ending December 2010. Across all civilian workers, wages and salaries, on the other hand, increased just 1.6 percent from a year ago.
Within the private sector, quarterly 12-month wage and salary increases throughout 2010 appeared to show very soft yet secure acceleration. However, this quarter’s decrease in the 12-month Employment Cost Index for private sector wages and salaries suggests that the case for the acceleration is tenuous. The increase in private sector wage and salary costs for the current 12- month period fell to1.6 percent compared to last quarter’s figure of 1.8 percent. This is the first drop in five quarters for this index.
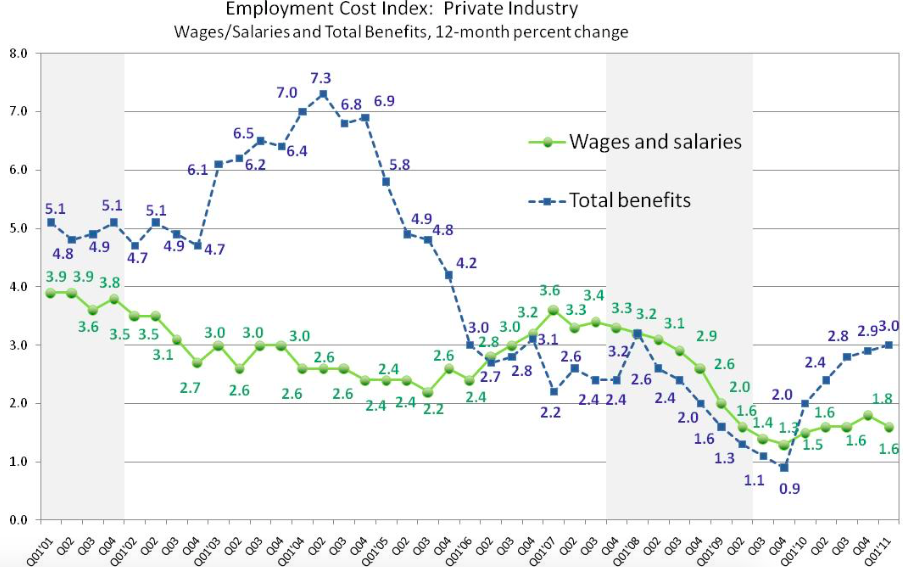
Gray shading shows official dates of recessionary periods.
While acceleration in the 12-month percent change in benefit costs paid by private sector employers has been steep since its upturn a year ago, its slope is showing signs of flattening, alongside the already muted cost increases in wages and salaries.
Surprise deceleration in health benefits costs to private sector employers
Unexpectedly this quarter, private sector employers are experiencing an easing in the year-on-year cost increases in employee health benefits. Employer costs for health benefits dropped to 3.4 percent for the 12-month period ending March 2011. This is down more than a full percentage point from a year ago (March 2010), when employers had experienced a 4.5 percent increase over the previous 12 months. More notably, one has to go back to December 1998 to find a lower 12‐month percent change in employers’ cost for health benefits per hour worked.6
U.S. Bureau of Labor Statistics, National Compensation Survey, Employment Cost Index—Supplemental Data, April 29, 2011, www.bls.gov/ect/sp/echealth.pdf, accessed 4-29-11. The Bureau of Labor Statistics’ Employment Cost Index includes measures of change in the cost of employee benefits. Data are collected for individual benefits within several benefit categories: paid leave, supplemental pay, insurance benefits, retirement and savings, legally required benefits, and other benefits. The measure of change in the cost of health insurance presented in this Supplemental Data document is the only benefit for which BLS makes separate data available.
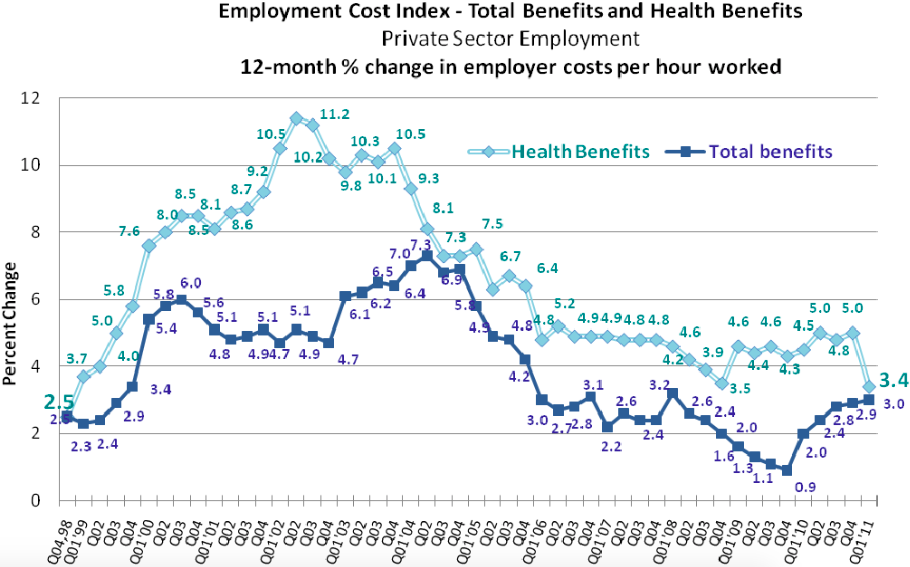
Gray shading shows official dates of recessionary periods.