2012 First Quarter
- No worries of employment costs “heating up” with ECI holding lower than inflation.
-
Deceleration in private sector health benefit cost index brings growth rate back to 1998 level.
-
Private sector employment cost index is trending strongest in the South.
Compensation growth in 2012 continues pattern of past two years
What employees cost their employers is just 1.9% higher than it was 12 months ago, according to the new Employment Cost Index released April 27th by the U.S. Bureau of Labor Statistics.1
Seasonally adjusted, compensation costs increased 0.4 percent for the 3-month period ending March 2012. This is slightly lower than December’s 3-month increase which was revised up to 0.5 from the initial 0.4 level reported in January 2012.
This year-on-year increase in total compensation costs is essentially flat with increases reported throughout 2010 and 2011, and signals no risk of economy-wide labor costs heating up.
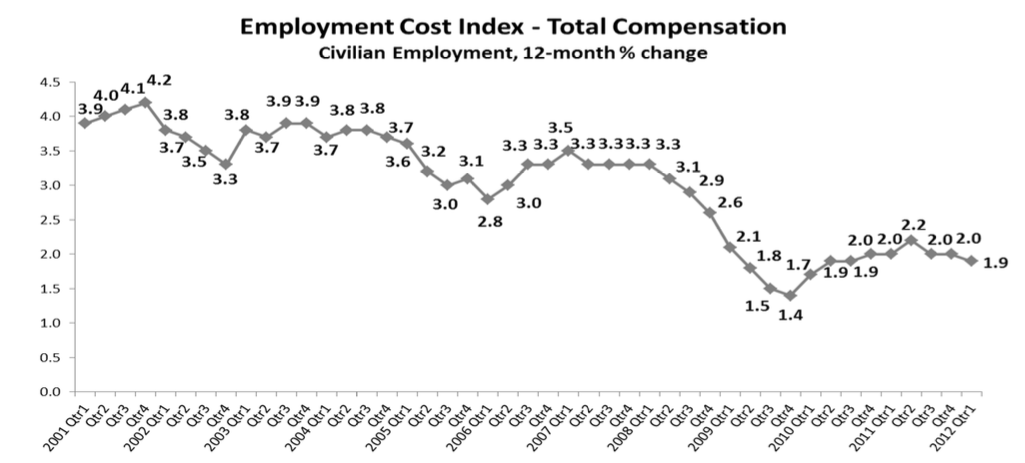
Annual inflation (CPI-U) currently stands at 2.7 percent2
Slower benefit cost increases offset slight private sector acceleration in wages and salaries
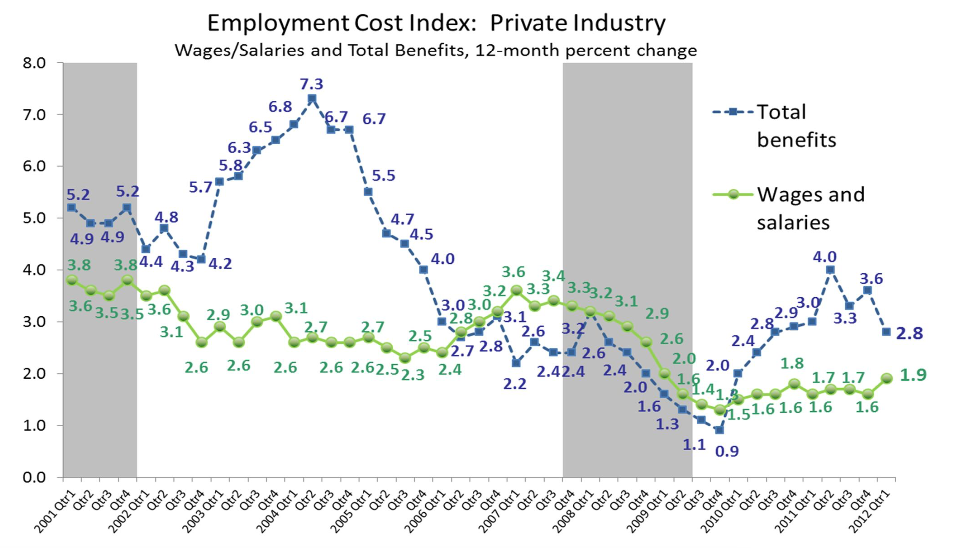
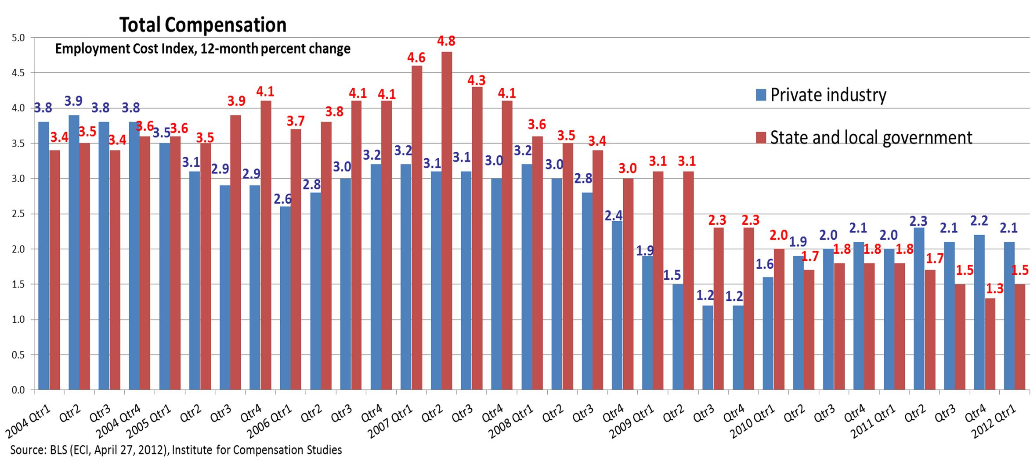
For private sector employers, total compensation costs are increasing annually at a fairly steady rate. For the seventh consecutive quarter, year-on-year increases in compensation costs have hovered around 2.1 percent. Breaking out wage and salary costs from benefit costs reveals an interesting dissonance, however. The 12-month percent change in wages and salaries ticked up this quarter. Increases in benefit costs, in contrast, decelerated again, on net slowing the growth rate of employment costs.
Private sector employees may feel that a 1.9 percent increase in wages and salaries over the past year is little to cheer about, but it is the highest 12-month increase since the first quarter of 2009. More notable and perhaps more fortunate for employers’ bottom line is that compensation costs for benefits.3
For Employment Cost Index, benefits data “are collected for individual benefits within several benefit categories: paid leave, supplemental pay, insurance benefits, retirement and savings, legally required benefits, and other benefits.” Employment Cost Index – Supplemental Data, p 2. Accessed 4/30/12 at http://www.bls.gov/ncs/ect/sp/echealth.pdf
rose only 2.8 percent over the 12 months ending March 2012. This is back down to where the year-on-year growth rate sat a year and a half ago (September 2010).
Institute for Compensation Studies™
Data Source: BLS (ECI Historical Listing, April 27, 2012)
ObamaCare already slowing inflation in employers’ health benefit costs?
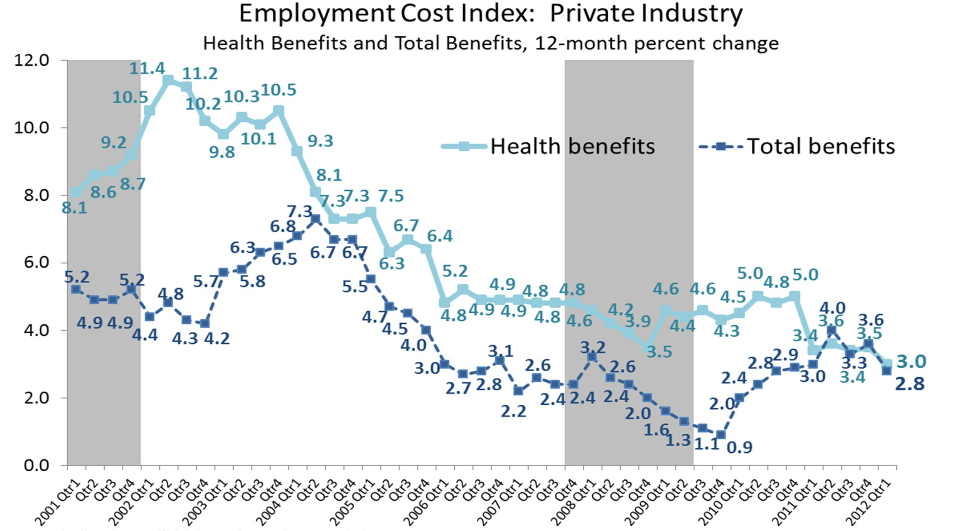
Every quarter throughout 2006 through 2010 (with the exception of the second half of 2008), the 12- month increase in the cost of health benefits that private sector employers shoulder hovered within a half percentage point of its average of 4.7 percent. But at the start of 2011 (Q1), the 12-month percent change in health benefit costs recorded in the ECI dropped notably and stayed in the range of 3.5 percent throughout 2011. This first quarter of 2012 recorded yet another half percentage point drop, decelerating to 3.0 percent for the 12 months ending March 2012. This is the lowest 12-month percent change in health benefit costs since 1998.4
It is important to acknowledge several shortcomings of the health insurance cost data from the ECI, including substantial employer nonresponse for this component of the survey, smaller sample size compared with the total benefit data, and BLS estimates the costs among various benefits if a respondent is “able to report only a single cost for a combination of benefits (for example, life insurance and health insurance)”. See Employment Cost Index – Supplemental Data. Accessed 4/30/12 at http://www.bls.gov/ncs/ect/sp/echealth.pdf.
Institute for Compensation Studies™
Data Source: BLS (ECI Historical Listing, April 27, 2012, http://www.bls.gov/ect/sp/echealth.pdf )
The unemployment rate remains above 8 percent despite the recession’s official end in June 2009. The bind this puts on household income could be a contributing factor to lower health benefit costs – if employees with employer-provided healthcare are avoiding medical services to avoid out-of- pocket healthcare expenses, employers will experience savings as well. It could also be that the deceleration in employment cost increases for health benefits are reflecting changes in the benefit policies of employers that are at least somewhat driven by the national healthcare reform legislation (Patient Protection and Affordable Care Act) coming on line.
Reporting on its annual National Survey of Employer-Sponsored Health Plans, Mercer concludes, “Against the backdrop of uncertainty created by health reform, employers are accelerating their efforts to bring health benefit cost under control.” 5
Mercer, “Employers accelerate efforts to bring health benefit costs under control” New York , 16 November 2011. Accessed 4/30/12 at http://www.mercer.com/press-releases/national-survey-employer-sponsored-health-plans.
Among other support for this claim, Mercer details that, this year, 32 percent of their large-employer respondents (500 or more employees) reported offering a high-deductible, account-based consumer-directed health plan, “up sharply from 23% in 2010.” Such high-deductible plans have been found to significantly reduce healthcare spending. 6
Beeuwkes Buntin M, Haviland AM , McDevitt R, and Sood N, “Healthcare Spending and Preventive Care in High- Deductible and Consumer-Directed Health Plans,” American Journal of Managed Care, Vol. 17, No. 3, March 2011, pp. 222–230, online abstract accessed 4/30/12, http://www.ajmc.com/publications/issue/2011/2011-3-vol17- n3/AJMC_11mar_Buntin_222to230/.
As employers make these cost-limiting adaptations to their benefits packages, it will be worth employers’ time to communicate effectively with their employees, articulating not only the business necessity for such policy changes, but how profits and employees are equally sharing the burden and also can benefit from ensuing behavior change.
South trending strongest for 12-month increase in private sector compensation costs
For the past two years, year-on-year growth in employment cost has been higher in the Northeast and Midwest than in the rest of the country, albeit trending flatter. With the start of 2012, that has changed. The South has continued its acceleration path and registered the fastest regional private sector growth in compensation costs, rising 2.3 percent for the 12-month period ending March 2012.
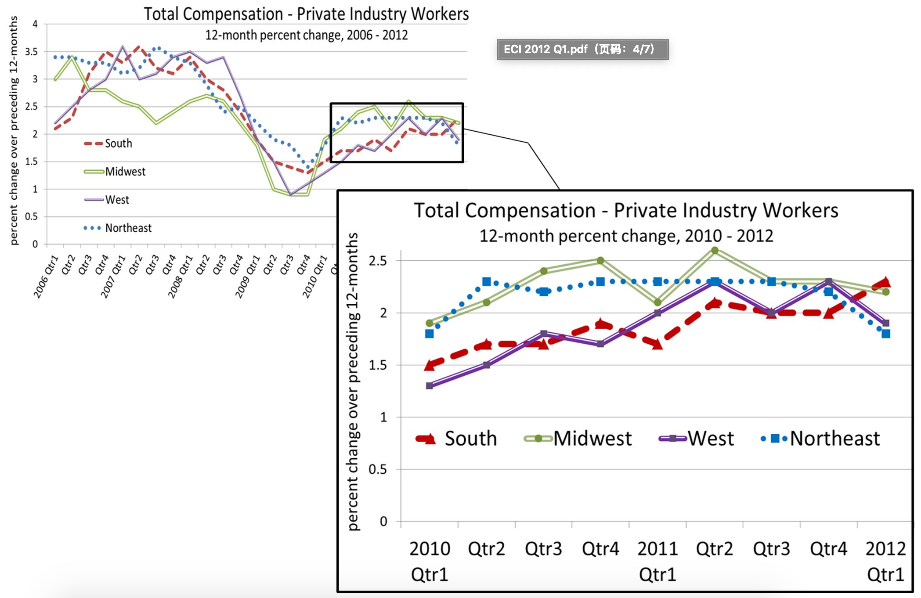
Within the major metropolitan areas, the largest percent change in total compensation for the 12- month period ending March 2012 occurred in Atlanta where compensation costs for private sector workers rose 3.2 percent. The second largest increase was in Dallas-Fort Worth where employment costs in March were up 2.6 percent over the previous year.
First acceleration in compensation increases for State and local government since Q3 2010
Still notably below the private sector’s 12-month employment cost index of 2.1 percent, the ECI for state and local governments ticked up slightly this quarter to 1.5 percent. After five quarters of flat or decelerating rates, the increase in compensation costs for the government sector demonstrated a bit of rebound to regain the year-on-year percent change recorded in Q3 2011.
For state and local government employees, acceleration is only in benefits
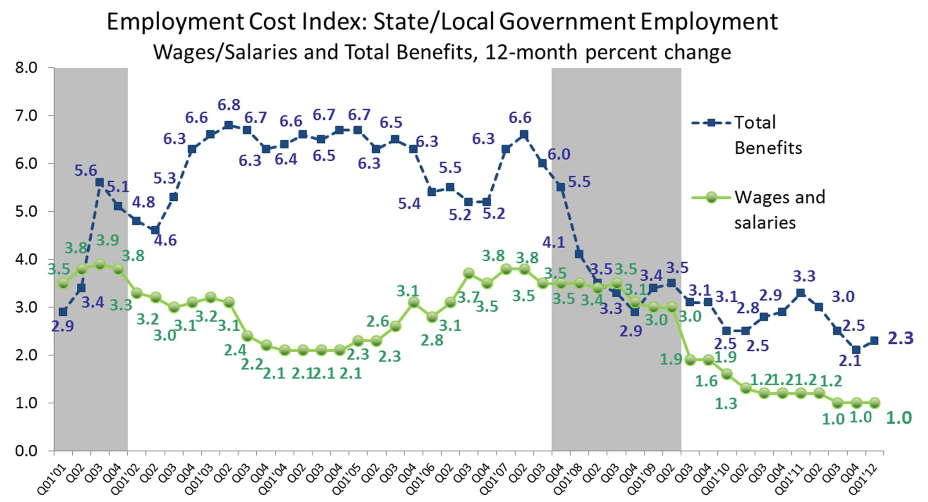
Despite the current low level of inflation, salary and wage costs for state and local governments are shrinking in real terms. For government employees (state and local), salary and wage costs again rose only 1.0 percent year-on-year. This is the third continuous quarter holding at an historic low for this ECI series (begun in June 1982).
It was the first acceleration in three quarters for the 12-month benefit cost index, rising to 2.3 percent, and buoying the overall employment cost index in the public sector.
Institute for Compensation Studies™
Data Source: BLS (ECI Historical Listing, April 27, 2012)


