2012 Second Quarter
- Total compensation increases continue slowing trend.
-
12-month percent change in private sector benefit costs drops precipitously
-
Private sector employers benefit from softening employee health benefit inflation.
Compensation growth back down to 2010 level
Employees cost their employers just 1.7 percent more than they did 12 months ago, according to the new Employment Cost Index released July 31st by the U.S. Bureau of Labor Statistics.1
Seasonally adjusted, compensation costs increased 0.5 percent for the 3-month period ending June 2012. This is slightly higher than March’s 3-month increase of 0.4 percent.
(Chart 1). Total compensation costs for all civilian employment rose 1.7 percent over the 12 months ending June 2012. This is even with overall inflation which currently stands at 1.7 percent (annual CPI-U).2
The Consumer Price Index for All Urban Consumers (all items) index has increased 1.7 percent before seasonal adjustment risen over the 12 months ending June 2012. See Consumer Price Index – June 2012, released July 17, 2012, USDL-12-1417. http://www.bls.gov/news.release/pdf/cpi.pdf
Chart 1
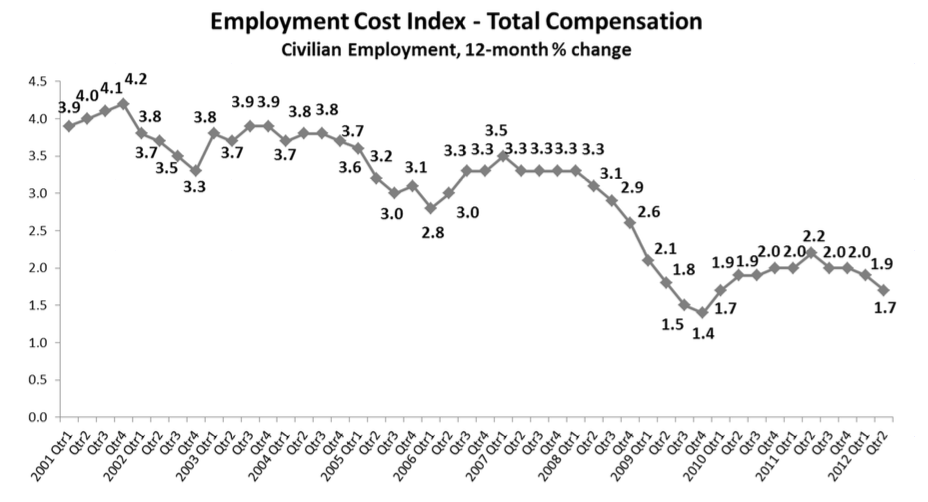
Data source: BLS (ECI Historical Listing, July 31, 2012)
This quarter’s deceleration in reported employment costs brings the year-on-year index back down to its Q1 2010 level, approaching the historic low of 1.4 percent registered at the end of 2009.
Increases in private sector benefit costs plummet, while wage/salary inflation essentially flat
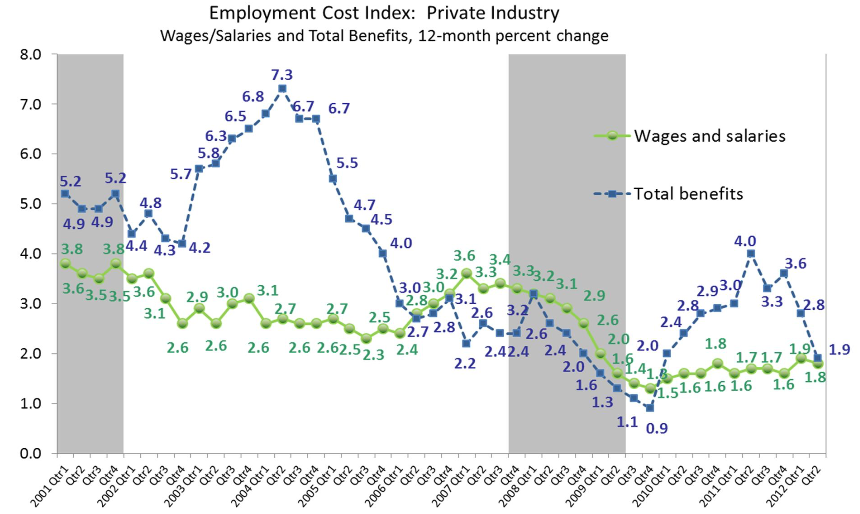
Annual increases in the costs of benefits for employees in the private sector rebounded for six quarters from a historic low of less than 1 percent in Q4 2009 to 4 percent in mid-2011. (Chart 2). Since then, the 12-month percent change has declined sharply, and this quarter recorded another drop. Compensation costs for benefits3
For the Employment Cost Index, benefits data “are collected for individual benefits within several benefit categories: paid leave, supplemental pay, insurance benefits, retirement and savings, legally required benefits, and other benefits. The measure of change in the cost of health benefits presented here is the only benefit for which BLS makes separate data available.” Employment Cost Index – Health Benefits, July 2012. Accessed 7/31/12 at http://www.bls.gov/ncs/ect/sp/echealth.pdf
rose just 1.9 percent over the 12 months ending June 2012. The year-on-year benefits growth rate hasn’t been this low since before the start of 2010, driving the Q2 2012 Total Compensation ECI down to 1.8 percent (See Chart 5) for private sector employees.
Chart 2
Institution for Compensation Studies™
Data source: BLS (ECI Historical Listing, July 31, 2012)
While year-on-year increases in benefits costs have slowed dramatically, 12-month wage and salary cost increases carried by private sector employers continue to plod along slightly under 2.0 percent.
Private sector employers continue to benefit from softening increases in employee health costs
The notably lower increase in the cost of overall employee benefits is underpinned, surprisingly perhaps, by a similar softening in the inflation rate of employer costs for employee health benefits. Used to hearing complaints of geometric increases in the cost burdens that employers bare for employee health benefits, it is surprising to note that, for private sector employers, increasing4
It is important to acknowledge several shortcomings of the health insurance cost data from the ECI, including substantial employer nonresponse for this component of the survey, smaller sample size compared with the total benefit data, and BLS estimates the costs among various benefits if a respondent is “able to report only a single cost for a combination of benefits (for example, life insurance and health insurance)... ECI may understate health insurer increases for a fixed set of plans because employers may reduce their contributions or employees may switch to lower cost health plans where there is an employee contribution.” See Employment Cost Index – Health Benefits. July 2010. Accessed 8/01/12 at http://www.bls.gov/ncs/ect/sp/echealth.pdf.
inflation rates in these costs hasn’t been the trend since 2002. (Chart3).In absolute level,5
Song G. Yi, “Consumer-Driven Health Care: What Is It, and What Does It Mean for Employees and Employers?” Compensation and Working Conditions Online, October 25, 2010, U.S. Bureau of Labor Statistics. Accessed 07/31/12, http://www.bls.gov/opub/cwc/print/cm20101019ar01p1.htm.
employer cost of employee health benefits have been rising for decades. But for the past decade, employers have been reining in health-benefit-cost inflation that had been speeding away in double-digits as late as 2004.
Chart 3
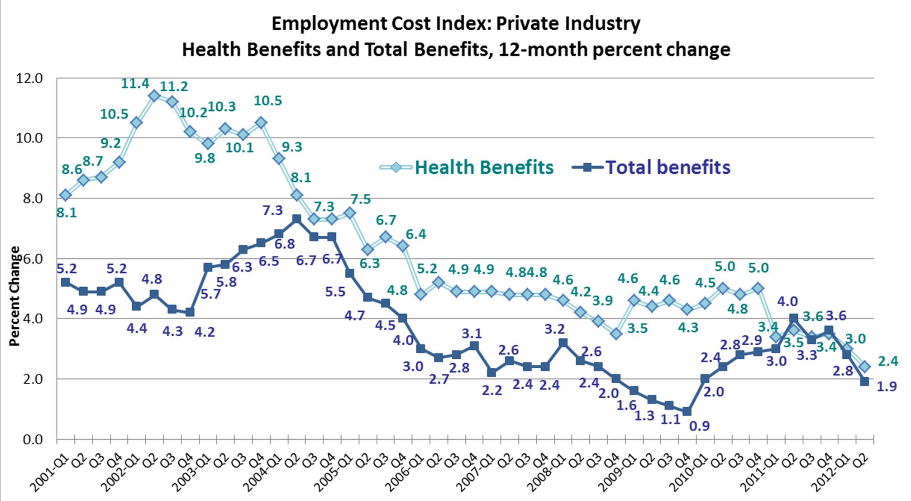
Data source: BLS (ECI Historical Listing and Employment Cost Index-Health Benefits July 2012, http://www.bls.gov/ncs/ect/sp/echealth.pdf)
From 2006 through the end of 2010, the quarterly 12-month increase in the cost of health benefits shouldered by private sector employers was pretty much steadied within a half percentage point of its four-year average of 4.7 percent. What is unclear is whether another lower steady-state inflation rate in employers’ costs for employee health benefits has been reached over the past two years – a rate closer to 3 percent, or whether this inflation rate is continuing to fall further. This quarter is the third in a row that recorded a drop in the 12-month percent change in the Health Benefit ECI, decelerating to 2.4 percent for the 12 months ending June 2012. This is an historic low for the data series which began in 1998.
If the increasing prevalence of high-deductible, account-based consumer-directed health plans (CDHP) is part of this story (see ICS' Q1 2012 Quarterly Commentary on the Employment Cost Index), employers should be aware of some cautionary evidence on the ultimate success of consumer-directed health plans (when success is broadly defined). While consumer-directed plans appear to be improving their customer experience, satisfaction rates on the part of employees may be higher with traditional health plans.6
See page 26 in Paul Fronstin, “Findings from the 2010 EBRI/MGA Consumer Engagement in Health Care Survey” Issue Brie, No. 352, December 2010. Employee Benefit Research Institute. Accessed 08/01/12 http://www.ebri.org/pdf/briefspdf/EBRI_IB_12-2010_No352_CEHCS.pdf (Satisfaction results were not included in the 2011 survey report.)
But more importantly, the verdict may still be out on the long-term cost savings of adopting CDHPs. In a 2-year retrospective study of consumer-directed health plans, researchers found that while families enrolling in and firms offering such plans did spend less on healthcare, “enrollment was associated with moderate reductions in the use of preventive care, despite the fact that these plans waived the deductible for preventive care.”7
Melinda Beeuwkes Buntin, Amelia M. Haviland, Roland McDevitt, and Neeraj Sood, “Healthcare Spending and Preventive Care in High-Deductible and Consumer-Directed Health Plans,” American Journal of Managed Care (2011) Vol. 17, No. 3, pp. 222-230. Accessed 08/01/12 at http://www.ajmc.com/publications/issue/2011/2011-3- vol17-n3/AJMC_11mar_Buntin_222to230
Clearly this is an important time to have a consistent data series like the National Compensation Survey (NCS) to accurately measure over time the cost burdens of employer-provided benefits. The roll out of the Patient Protection and Affordable Care Act will create new challenges, however, for consistently measuring the costs of employer-provided health care benefits. Brian Mauersberger, Bureau of Labor Statistics economist, asks, “How will employer cost data change if employers are simply providing funds to employees [to purchase their own insurance in an exchange]? Is providing funds equivalent to giving ‘access’ to health care?...To continue to track these benefits in changing times, the NCS may have to refine some of its concepts, definitions, and collection procedures to adapt to new plan types and cost structures.”8
Brian Mauersberger, “Tracking Employment-Based Health Benefits in Changing Times,” Compensation and Working Conditions Online, January 27, 2012. U.S. Bureau of Labor Statistics. Accessed 07/31/12 http://www.bls.gov/opub/cwc/print/cm20120125ar01p1.htm.
Weakness in Construction and Professional/Business Services holds down compensation increases
If one is looking for work where compensation is on a stronger upward path than the average, education and health services, along with trade, transporation and utilities, may be current contenders. (Chart 4). Although, this is a bit like finding the strongest among a very weak field.
Chart 4
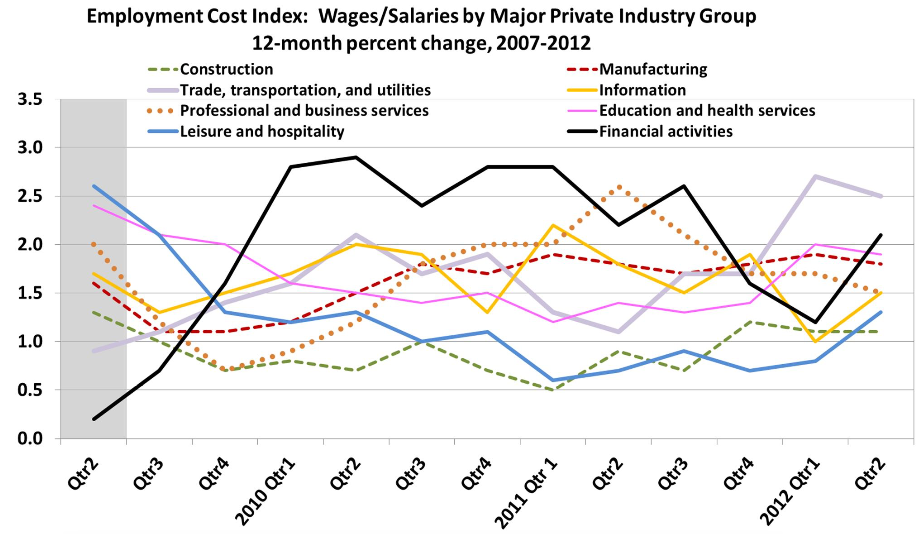
Data source: BLS (ECI Historical Listing, July 31, 2012)
In state and local government, compensation increases convergence with the private sector and employee benefit costs begin acceleration...again
Compensation for employees in state and local governments may also be through the worst of the recent recession-triggered storm, or at least seeing a break in the clouds. The 12-month ECI for state and local governments again ticked up slightly this quarter to 1.6 percent. (Chart 5). In contrast, the private sector ECI experienced another decline, dropping to 1.8 percent. The government sector’s employment costs appear to be rebounding slightly, albeit from the historically low level registered at the close of 2011 and remaining below that of the private sector.
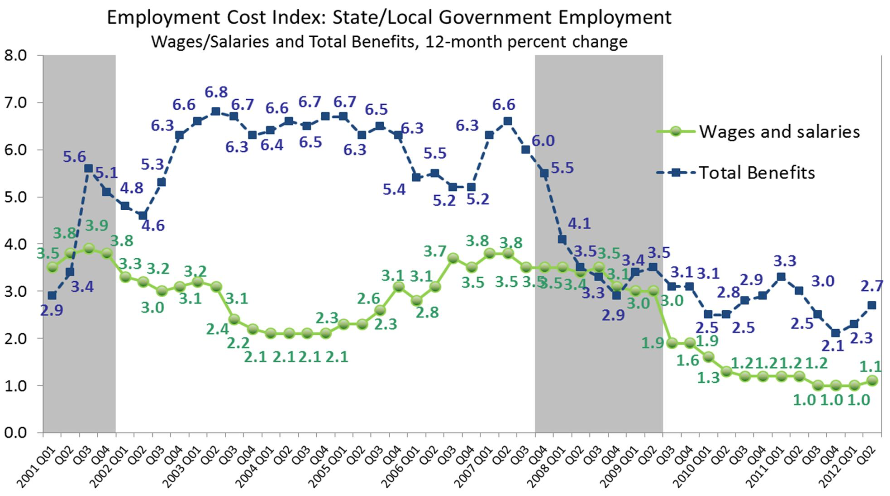
The employment costs of benefits for state and local governments appear to have cycled into a third round of acceleration since the end of 2008. (Chart 6). The gentler downward trending that began in 2008 continues, but the government sector ECI for benefits has exhibited a bit of a roller coaster pattern over the past four years.
Chart 5
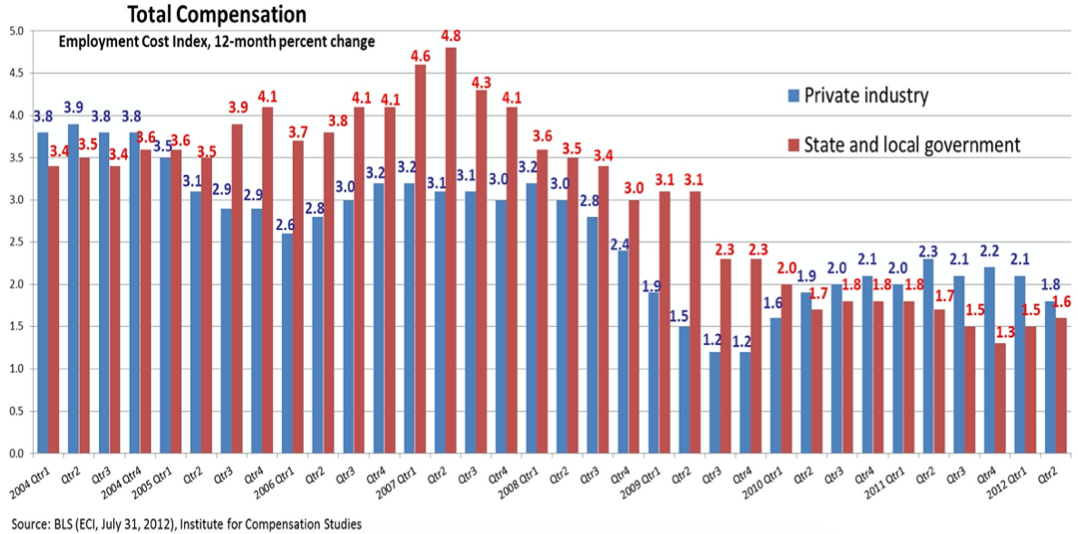
Chart 6
Institution for Compensation Studies™
Data source: BLS (ECI Historical Listing, July 31, 2012)


