2012 Third Quarter
- Total compensation increases rebound slightly.
-
Employment Cost Index aligns with October’s Employment Situation report, both signaling slow but steady recovery in the U.S. labor market.
-
Public sector employers continue to face upward trend in employee health benefit inflation.
Civilian workers costing employers two percent more than a year ago
Annual inflation in employment costs ticked up this quarter for the 12-month period ending September 2012, returning to the dominate rate of the past two decades. The cost of U.S. employees’ wages, salaries and benefits rose 2.0 percent over the previous 12 months, according to the new 12-month Employment Cost Index released October 31st by the U.S. Bureau of Labor Statistics1 . Last quarter, these compensation costs rose only 1.7 percent fort he 12 months ending June 2012 (Chart1).
Chart 1
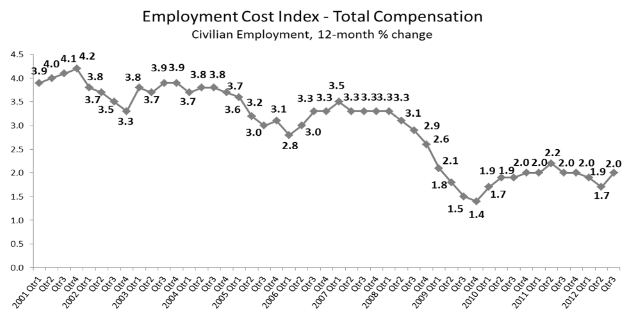
Data Source: BLS (ECI Historical Listing, October 31, 2012)
This is the second quarter in a row that registered a 12-monthEmployment Cost Index equal to the general inflation rate. General price inflation experienced by U.S. households is currently 2.0percent (annual CPI-U).2
Like prices in any market, compensation (the price of labor) responds to the forces of supply and demand. This quarter’s gentle rebound in the Employment Cost Index aligns with evidence from the Bureau of Labor Statistics’ monthlyEmployment Situation reports that continues to signal slow but steady recovery of the U.S. labor market. Throughout 2012, employment growth has averaged a monthly gain of 157,000, with a very consistent gain of between 148,000 to 192,000 jobs over the past four months.3
This quarter’s increase in the percent change of total compensation for the12 months ending September 2012 was driven by a 2.6 percent rise in the costs borne by employers for employee benefits.Inflation in wages and salaries held flat with last quarter’s 12-month increase of 1.7 percent. On average, employer-provided benefits compose roughly 30 percent of the total compensation costs of employees, with wages and salaries composing the remaining 70 percent.
Benefit cost inflation turns up in private sector, continuing steady climb in government sector
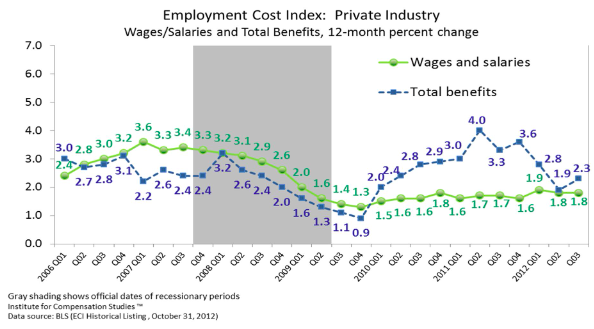
The annual rate of increase in the costs of employee benefits in the private sector rose this quarter, as it did for state and local employees (Charts 2 and 3). But, unlike in the government sector, the uptick in the Benefits ECI for the private sector is not part of a repetitive pattern. For government sector employees, this is the third consecutive quarter for which the 12-month ECI for total benefits rose. For private sector employees, the 12-month ECI for total benefits still remains below levels reported throughout most of 2010 and 2011. In both the private and government sectors, increases in wage and salary costs remain flat, albeit at a slightly higher level in the private sector.
Chart 2
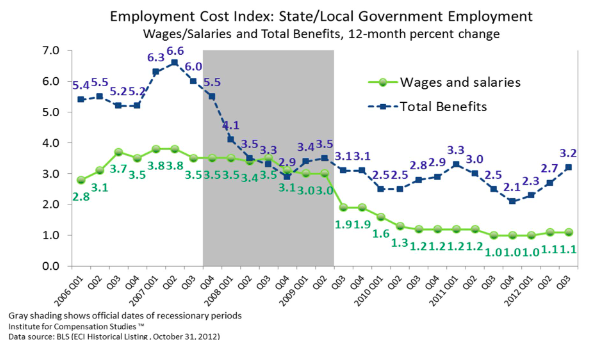
Chart 3
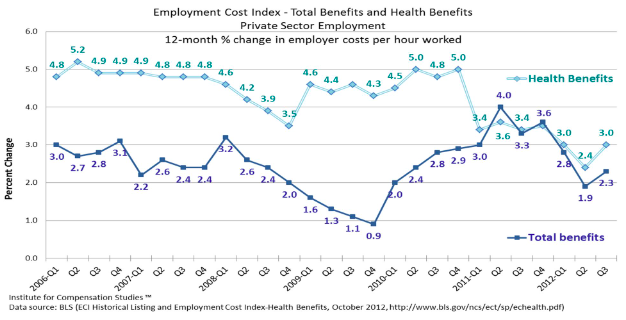
Increases in costs to employers of employee health benefits still soft 4
While in absolute level the costs employers pay for employee health benefits are rising, and have been doing so for decades,5 this quarter’s rate of increase is the second lowest on record since the series’ start in 1998(Chart 4).
Chart 4
(See ICS' Quarterly Commentary on the Employment Cost Index from Q1 and Q2 of 2012for further discussion of employers to reining in of employee health care costs.)
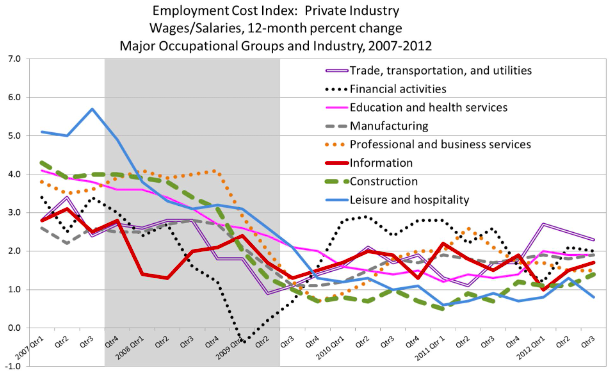
Information, Construction and Manufacturing experience increase in 12-month wage/salary inflation
The general pattern across occupational groups and industry is one of convergence in wage and salary inflation over the 12 months ending September 2012(Chart 5). Increases in wage and salary costs for employers of information, construction and manufacturing workers sped up; while employers in trade, transportation and utilities, finance, education and health services experienced slow-downs in wage and salary inflation, pushing towards 2 percent.
The two outliers in this convergence pattern are professional and business services, and leisure and hospitality.After a summer blip (these data are not seasonally adjusted), 12-month increases in wage and salary costs in the leisure and hospitality industry have fallen back down to under one percent, where they were throughout 2011 and the first quarter of 2012. Wage and salary cost increases also continue to slow for employers of professional and business services workers.
Chart 5
- 1Seasonally adjusted, compensation costs increased 0.4 percent for the 3-month period ending September 2012. This is slightly lower than June’s 3-month increase of 0.5 percent.
- 2Over theprevious12 monthsending September 2012,the Consumer Price Index for All Urban Consumers (all items) index increased 2.0 percent before seasonal adjustment. See Consumer Price Index –September2012,released Tuesday, October 16, 2012,USDL-12-2070. http://www.bls.gov/news.release/pdf/cpi.pdf.
- 3SeeU.S. Department of Labor, Bureau of Labor Statistics, “The Employment Situation –October 2012,” November 2, 2012, USDL-12-2164. Retrieved 11/2/12 from http://www.bls.gov/news.release/pdf/empsit.pdf.
- 4The health insurance costdatafrom the ECIhas shortcomings, including employernonresponse and BLS processes that may result in ECIunderstating“health insurer increases fora fixed set of plans...”See Employment Cost Index –Health Benefits. October 2012. Accessed 11/01/12 at http://www.bls.gov/ncs/ect/sp/echealth.pdf.
- 5SongG. Yi, “Consumer-Driven Health Care: What Is It, and What Does It Mean for Employees and Employers?” Compensation and Working Conditions Online, October 25, 2010, U.S. Bureau of Labor Statistics. Accessed 07/31/12, http://www.bls.gov/opub/cwc/print/cm20101019ar01p1.htm.