
U.S. Employment Cost Index, Q4 2024 Commentary
2024 Fourth Quarter Summary – Year-on-year growth of employee compensation softens but remained solidly above consumer inflation.
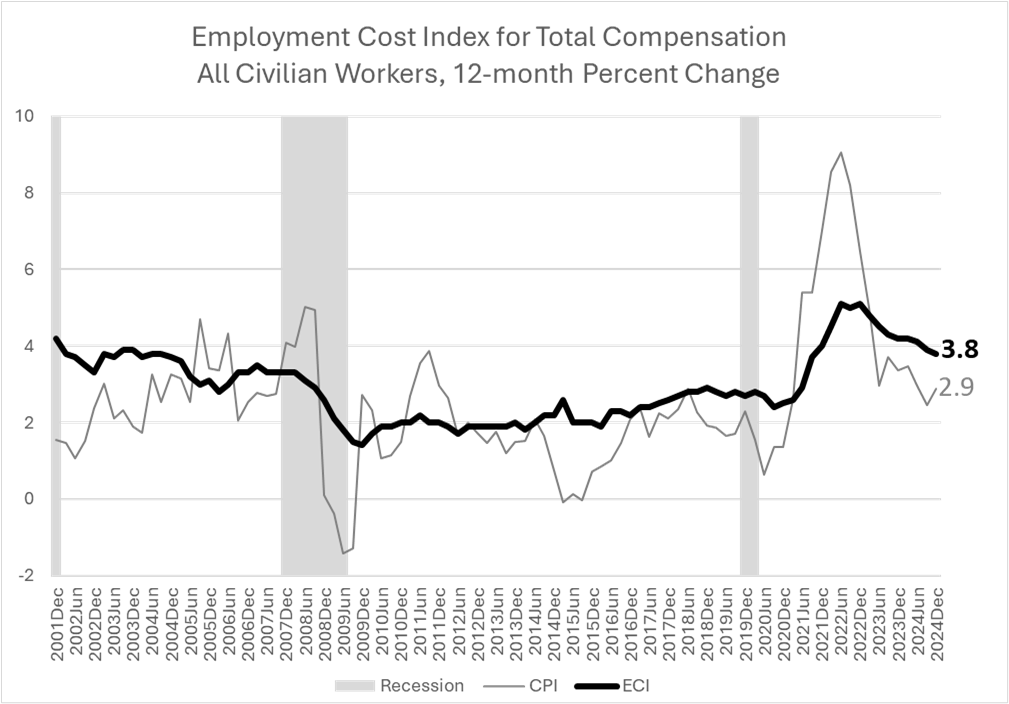
For the seventh quarter in a row, the 12-month growth rate of employee compensation in the U.S. (controlling for occupational composition) exceeded that of the general cost of living; the difference, however, has narrowed slightly. Released on January 31, 2025, the U.S. Bureau of Labor Statistics’ Employment Cost Index (ECI) for the 12 months ending in December registered 3.8 percent. The US household Consumer Price Index (CPI) for the same 12-month period was 2.9 percent. (Chart 1).
Chart 1
Institute for Compensation Studies
Data Source: U.S. Bureau of Labor Statistics, Employment Cost Index, December 2024, released January 31, 2025.
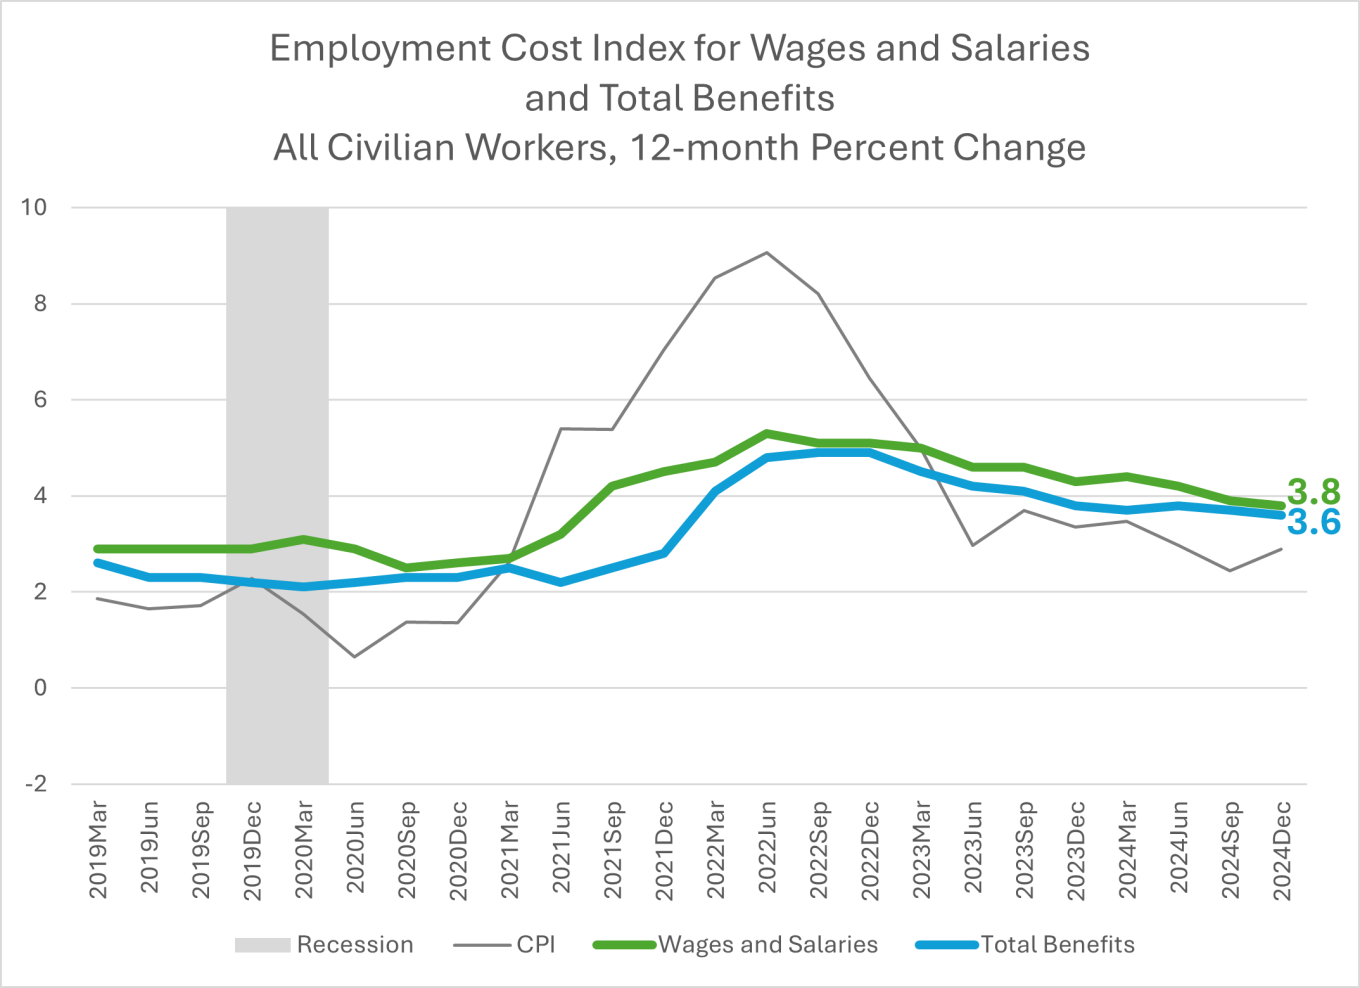
Across all civilian workers, the annual growth rate of costs for wages and salaries, while softening, remained above that for total benefits, as is typical. In the fourth quarter of 2024, the ECI 12-month growth rate was 3.8 percent for wages and salaries and 3.6 percent for total benefits. (Table 1 and Chart 2).
Table 1

Institute for Compensation Studies
Data Source: U.S. Bureau of Labor Statistics, Employment Cost Index, December 2024, released January 31, 2025.
Chart 2
Institute for Compensation Studies
Data Source: U.S. Bureau of Labor Statistics, Employment Cost Index, December 2024, released January 31, 2025.
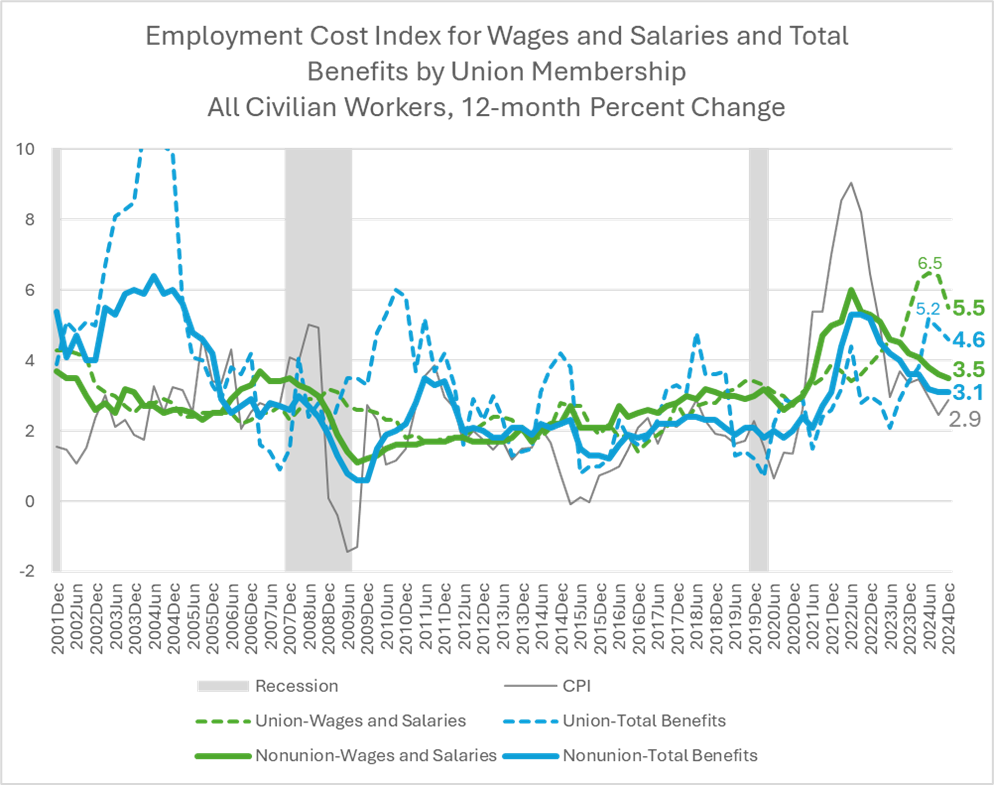
While down from its June peak, the growth rate of unionized workers’ compensation continues to outpace that of their nonunion peers.
After peaking in June 2024, the 12-month growth rates of wages and benefits for union workforces registered 5.5 percent and 4.6 percent, respectively. While continuing the softening that began in Q3, the year-on-year ECIs for wages and salaries and benefits of unionized workforces remained notably above those reported for nonunion workers. (Chart 3).
Chart 3
Institute for Compensation Studies
Data Source: U.S. Bureau of Labor Statistics, Employment Cost Index, December 2024, released January 31, 2025.
The alternating wages and salaries ECI peak and trough trend we see beginning in 2021 for union and nonunion workforces is not uncommon and reflects the differences in between workers with and without multi-year contracts. The 12-month ECI for non-union workers (whose wages usually change annually) led the way, accelerating strongly in 2021 and peaking at 6 percent in June 2022), largely in sync with pandemic-generated inflation. By contrast, unionized workers’ wages accelerated more slowly, through negotiations as multi-year contracts came to term. The union workforce ECI peaked two years later and higher (6.5 percent in June 2024), making up ground that was lost in inflation-adjusted compensation earlier in the inflation cycle.
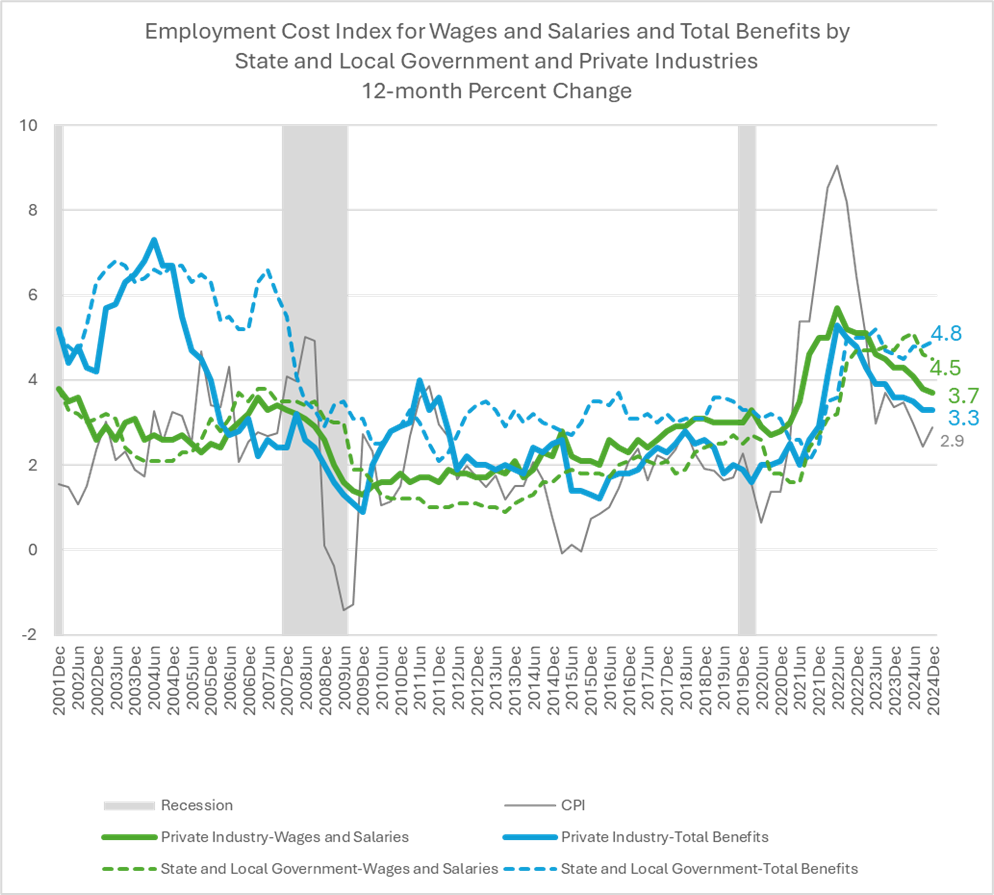
A muted version of the same pattern is evident in the comparison of the private sector workforce to state and local government workers, who have high unionization rates. The 12-month growth rate of wages and salaries in the government sector has been above that paid by private sector employers since Q2 2023, and since Q4 2022 for benefits. (Chart 4). The ECI gap appears to be slowly converging for wages and salaries. This quarter, however, showed no shrinkage in the 12-month ECI gap between state and local government sector benefits and those provided by private sector employers, with the latter ticking up to 4.8 percent, year on year.
Chart 4
Institute for Compensation Studies
Data Source: U.S. Bureau of Labor Statistics, Employment Cost Index, December 2024, released January 31, 2025.
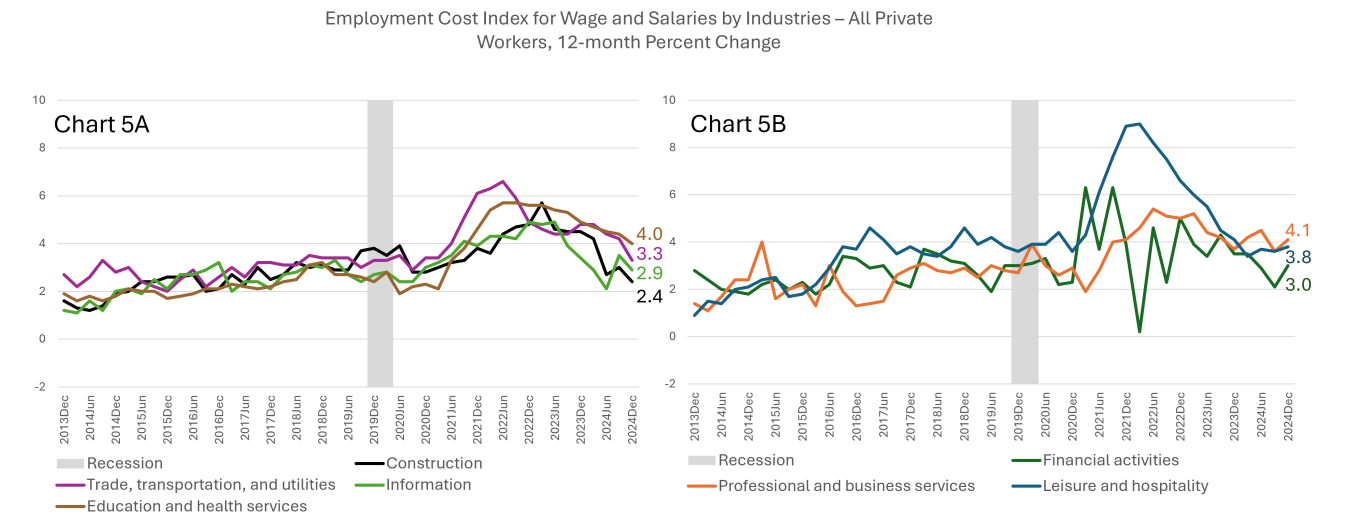
Wages and Salary growth varies by industry for private sector employers
It’s important to note that employee compensation does not rise in tandem across the private sector. Year-on-year growth rates in salary and wages slowed this quarter in Construction; Trade transportation, and utilities; Information; and Education and health services. Meanwhile, growth rates of wages and salaries ticked up in Financial activities; Professional and business services; and Leisure and hospitality. (Chart 5).
Chart 5
Institute for Compensation Studies
Data Source: U.S. Bureau of Labor Statistics, Employment Cost Index, December 2024, released January 31, 2025.
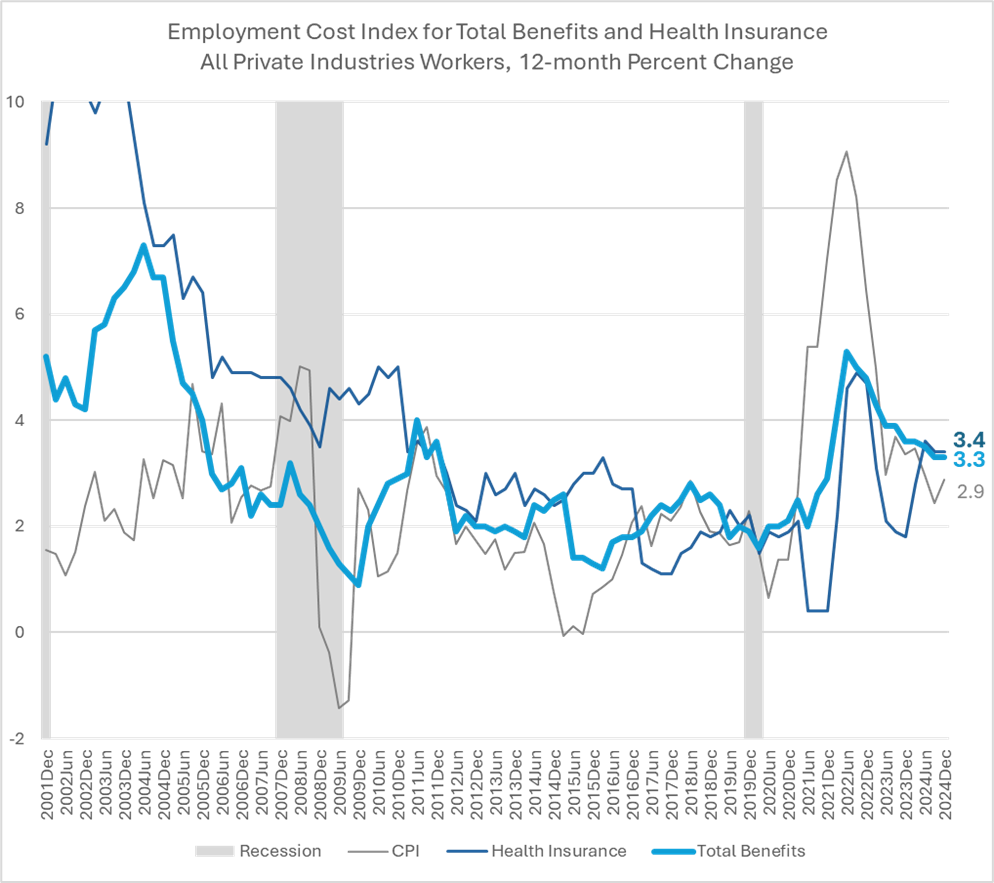
ECI for private sector employer-provided health insurance holds flat
Private sector employer costs for employee health insurance rose 3.4 percent over the past 12 months, just slightly above the growth rate of benefits costs overall. This quarter’s health insurance ECI was unchanged from Q3 and little different the Q2 rate of 3.6 percent. (Chart 6.) These three quarters of relative stability in the growth rate of private sector health insurance benefit costs are a welcome change from what has been a post-Covid wildly-fluctuating yet upward trend that ended the dramatic downward pattern in place from the early 2000s.
Chart 6
Institute for Compensation Studies
Data Source: U.S. Bureau of Labor Statistics, Employment Cost Index, December 2024, released January 31, 2025.
Data Notes: The Employment Cost Index (ECI) is produced by the U.S. Bureau of Labor Statistics to measure trends in the costs of compensation paid by employers to their employees, controlling for composition of the workforce. The ECI is one of the labor market indicators used by the Federal Reserve Board to monitor the effects of fiscal and monetary policies and is released quarterly with a one-month lag.
Data for the Q4 2024 reference period (the 3-months ending in December 2024) were collected from a probability sample of approximately 26,700 occupational observations selected from a sample of about 6,300 private industry establishments and approximately 7,400 occupational observations selected from a sample of about 1,400 state and local government establishments that provided data at the initial interview.
Link to most recent ECI release: https://www.bls.gov/news.release/eci.toc.htm.
The Institute for Compensation Studies (ICS) at Cornell University’s ILR School is an interdisciplinary center that researches, teaches and communicates about monetary and non-monetary rewards from work, and how these rewards influence outcomes for individuals, companies, industries, and economies. At the crossroads between scholarship and practice, ICS is an exchange dedicated to helping new knowledge hit its mark in the world of work.
Contact:
Erica L. Groshen
Senior Economics Advisor
Institute for Compensation Studies
Authors:
Linda Barrington
Seung-Hun Chung
Erica L. Groshen
The Institute for Compensation Studies