
U.S. EMPLOYMENT COST INDEX, Q2 2025 COMMENTARY
2025 Second Quarter Summary
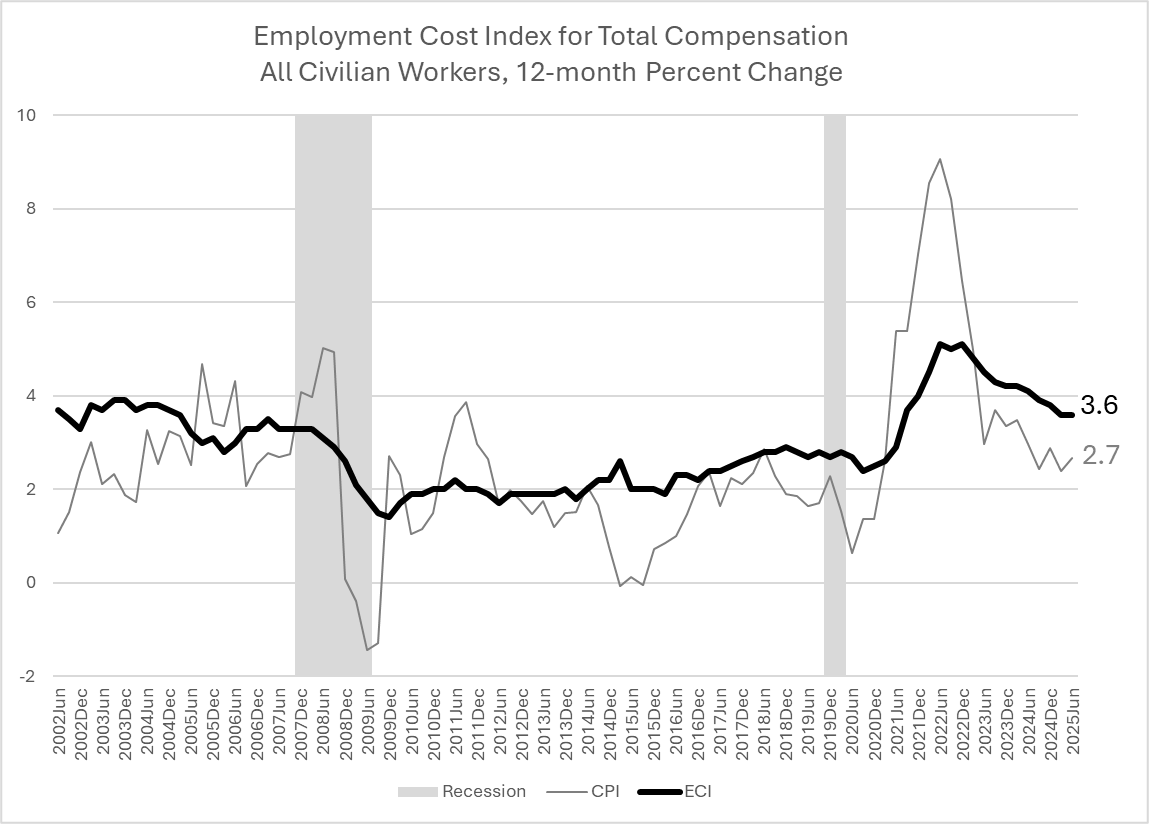
Released on July 31, 2025, the U.S. Bureau of Labor Statistics’ U.S. Employment Cost Index (ECI), which controls for occupational composition, reported in at 3.6 percent for the 12 months ending in June. This is flat with the 12-month current-dollar ECI reported in Q1. Important to note is that the Q2 US household Consumer Price Index (CPI) is 2.7 percent (all items index) for the 12 months ending June, 0.3 percentage points higher than the 12 months ending May. This year-on-year acceleration of inflation balanced against the flat 12-month ECI indicates a slight weakening of the purchasing power of employees’ pay growth since June 2024. (Chart 1, Table 1).

Total and Healthcare Benefits
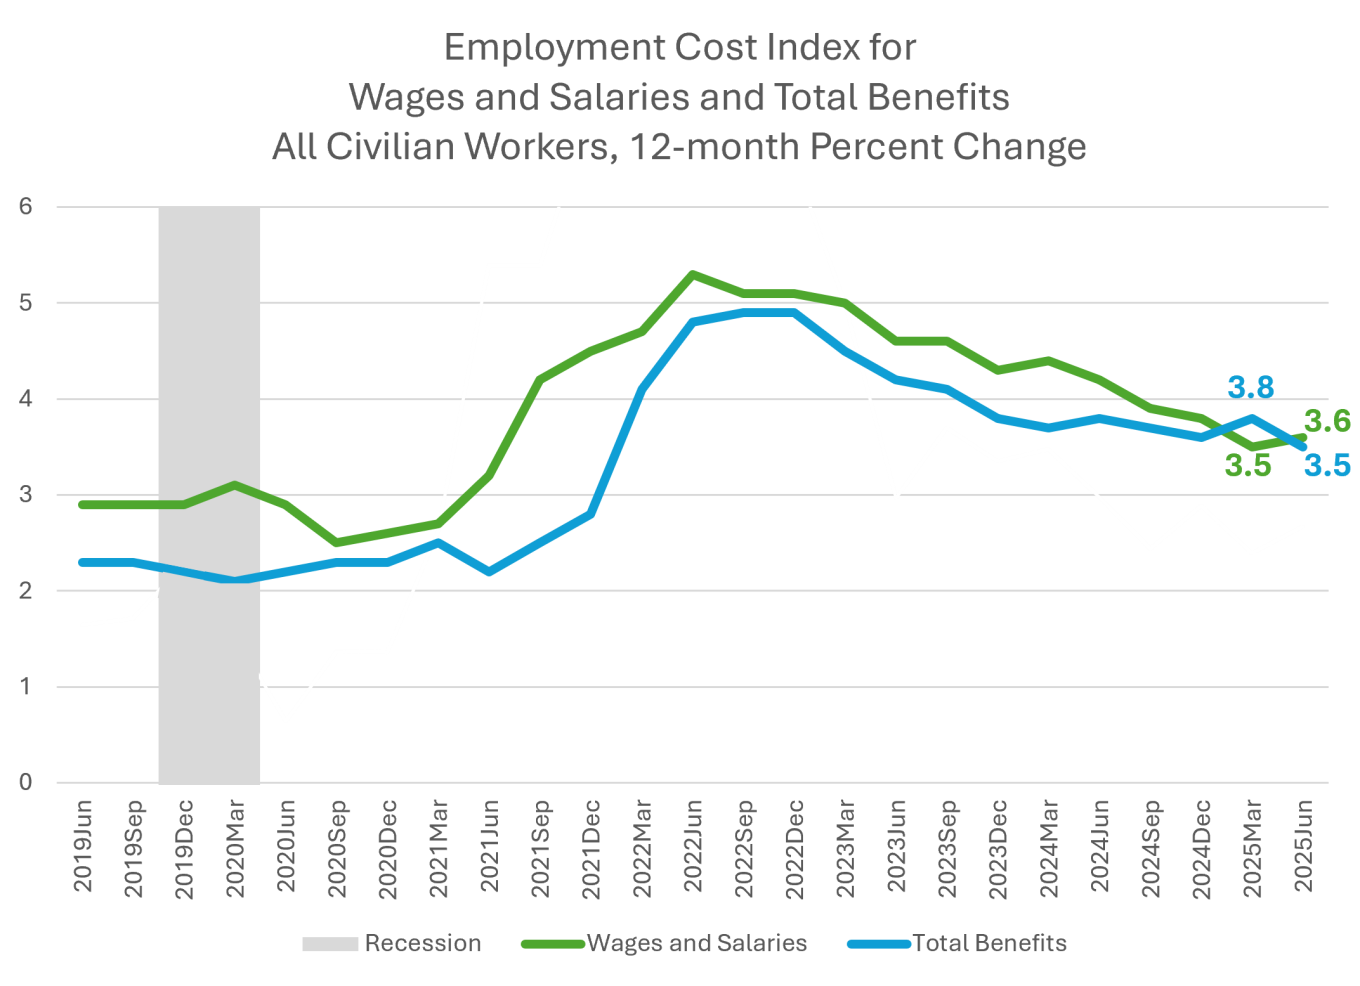
Looking more closely at the pay and benefits components of compensation reveals interesting countervailing dynamics. The flat 12-month ECI between Q2 and Q1 is the result of notable deceleration (0.3 percentage points) for total benefits balanced by an acceleration in wages and salaries of 0.1 percentage points. (Wages and Salaries account for roughly 70% of employers’ costs for employee compensation.) After its tick up last quarter, the Q2 2025 12-month ECI for benefits has reverted to its downward trend. Q2 2025 recorded the softest year-on-year cost increase for employer-provided benefits since Q4 2021, returning to a consistent pattern below that of wages and salaries (Chart 2).
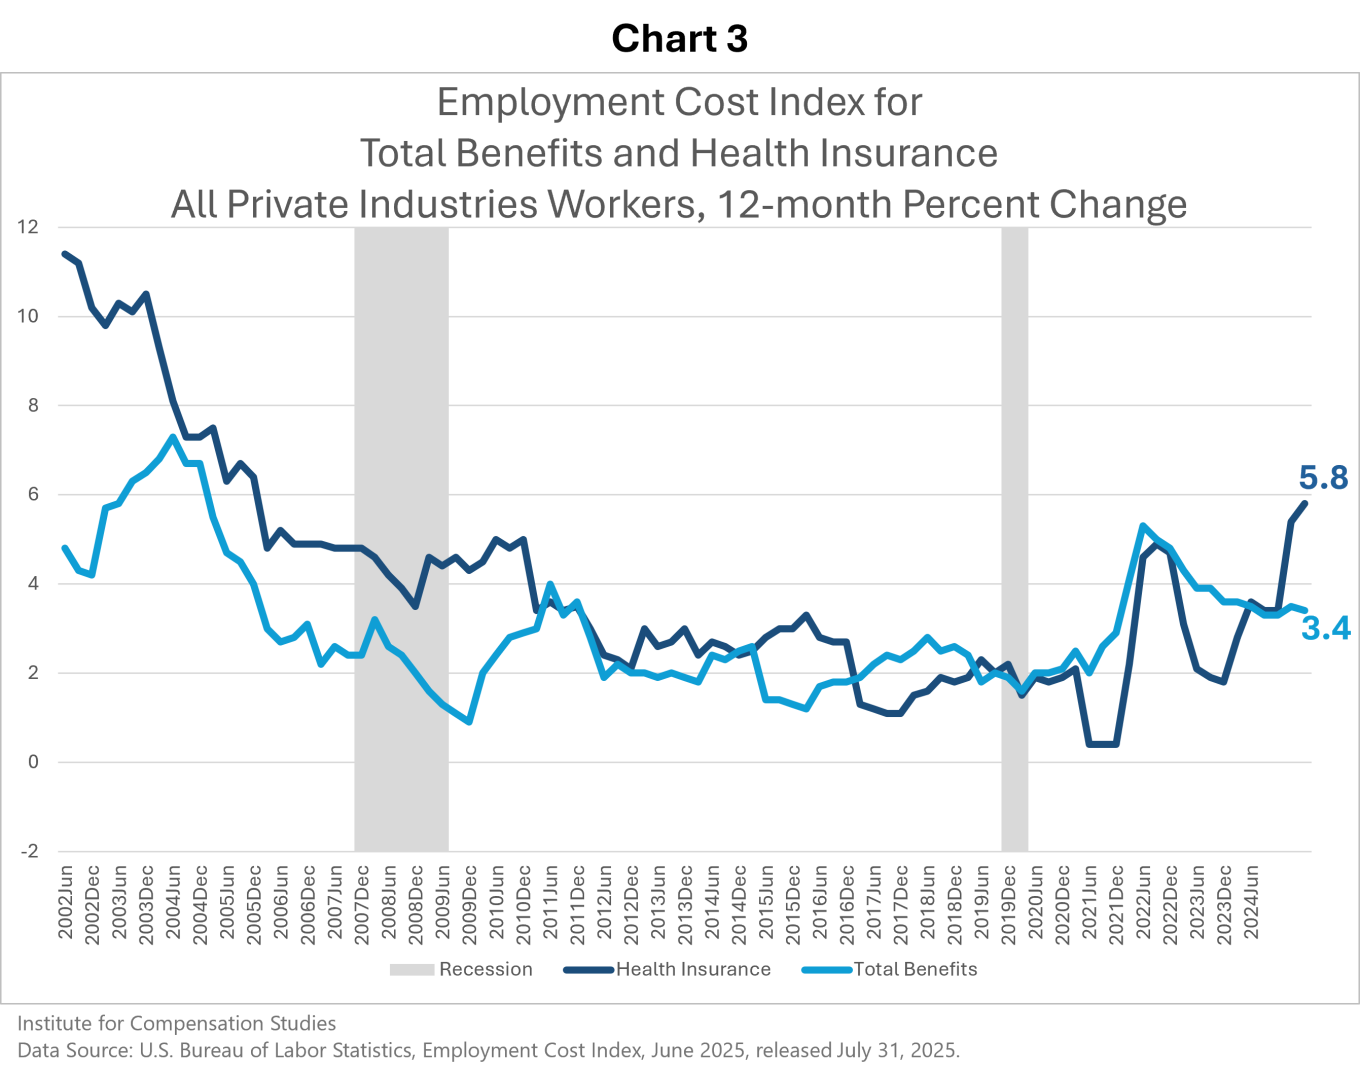
Within the private sector, employee benefits show a further dichotomy. The cost of total benefits provided to private sector employees rose even more slowly, year-on-year, than for the civilian workforce overall, 3.4 percent versus 3.5 percent, respectively. However, the costs of healthcare benefits continue their rapid acceleration, up 5.8 percent compared to a year ago. Approaching 6 percent, the 12-month ECI for private sector health insurance is moving into an inflationary range not seen for 20 years (Chart 3).
Union/Nonunion Differences
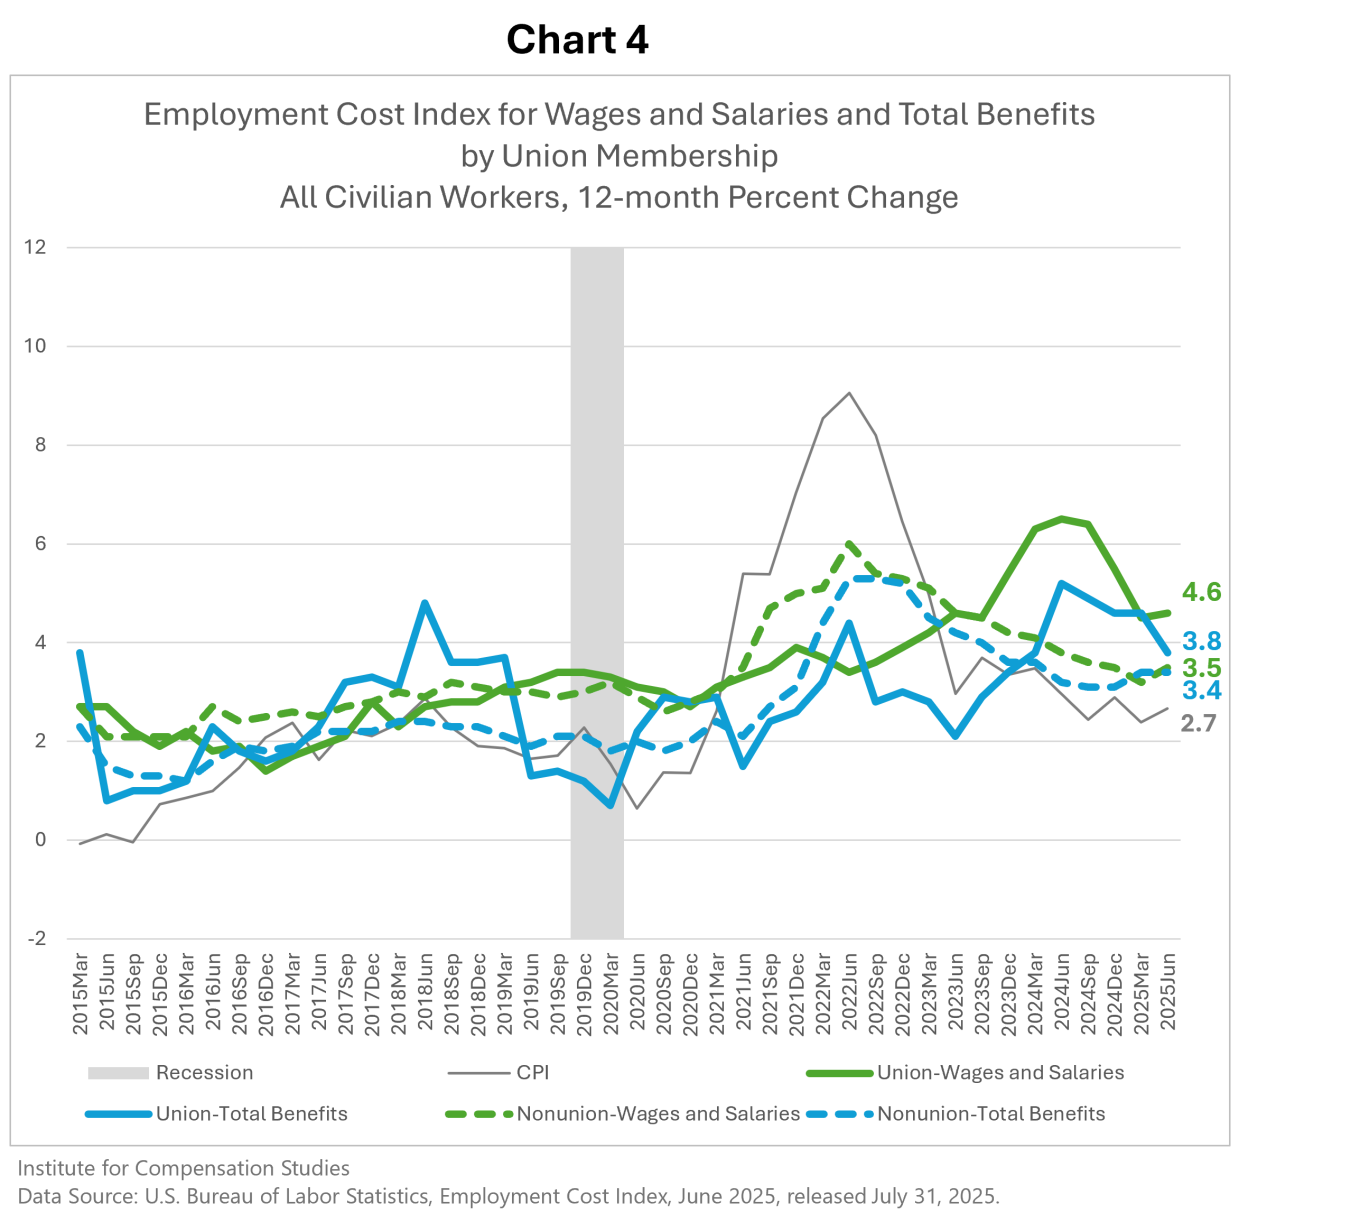
Unionized and nonunion workers’ compensation growth have converged now that the delayed union wage response to the pandemic-related spike in inflation (2021-2023) has largely passed. (Chart 4).
The pandemic-related spike in inflation was reflected much more rapidly in nonunion compensation than in unionized workers’ compensation, peaking in late 2021/early 2022 for nonunion workers. Because many multi-year collective bargaining agreements had little or no indexation for inflation, the inflation-related increases for union workers peaked almost two years later, as collective bargaining agreements were renegotiated. The pattern is most pronounced in wages and salaries.
Occupation differences
Looking at occupational groups separately shows that wage and salary growth for the past 12 months was unusually compressed. It also remains elevated compared to a decade ago (Chart 5).
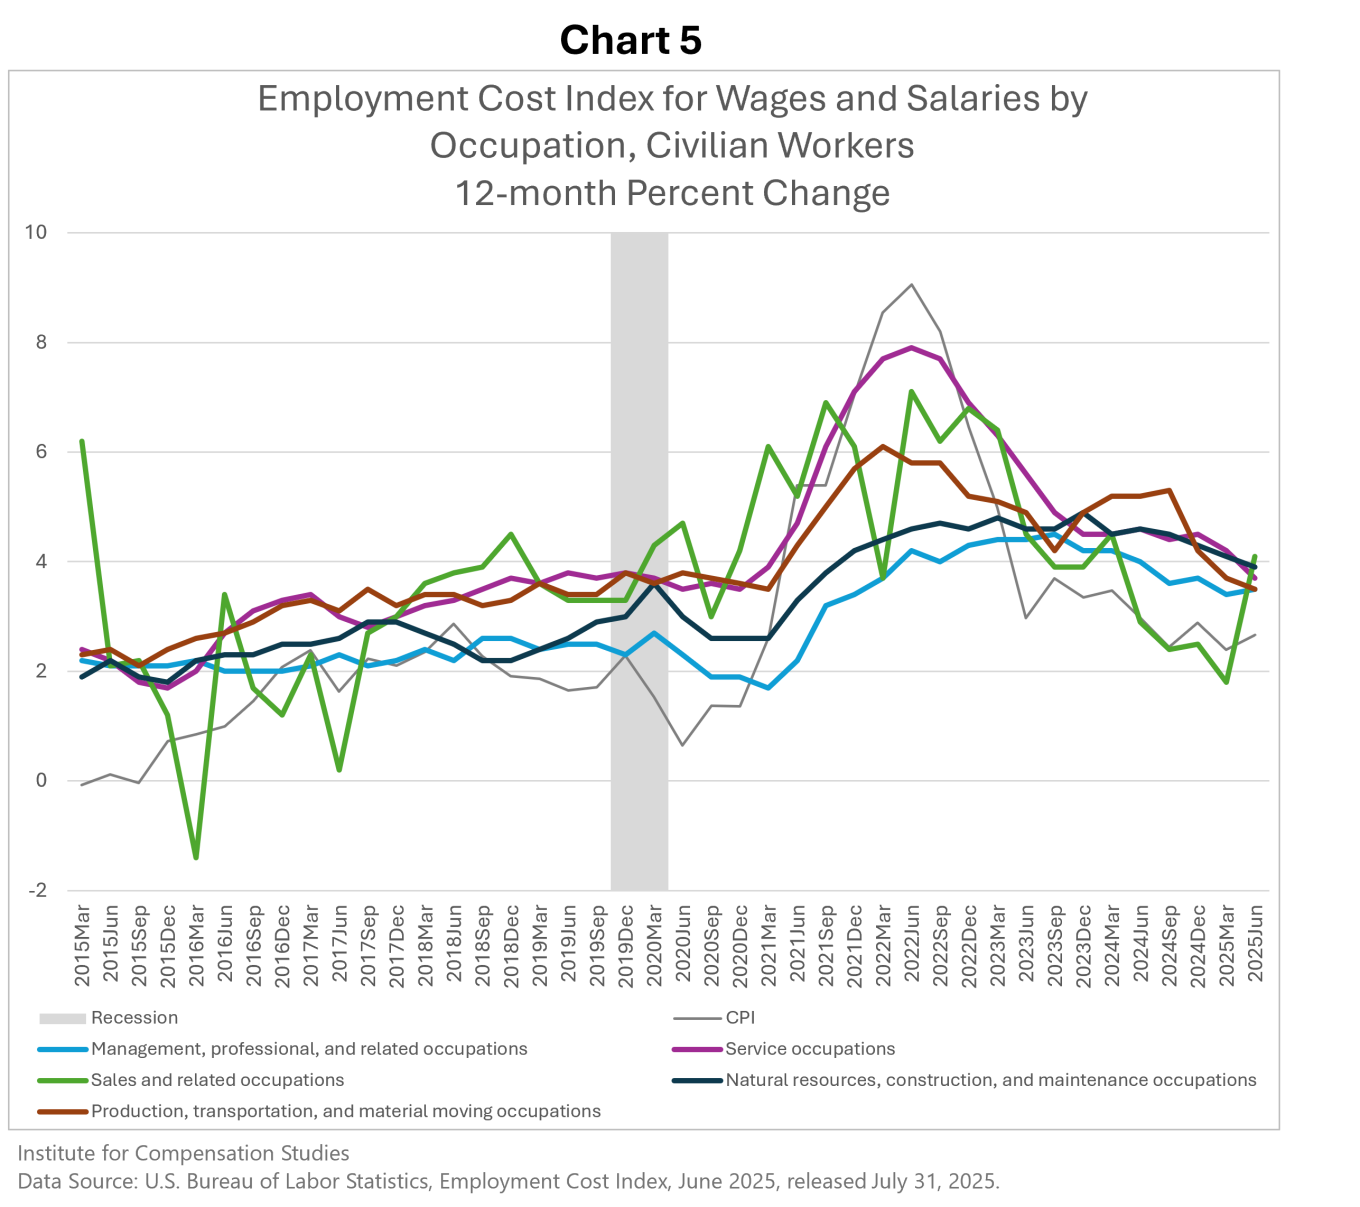
It has been ten years since occupational groups’ wage and salary growth were so strongly compressed. Since 2015, management, professional and related occupations’ pay has lagged most of the other groups quite consistently. Sales and related occupations’ wage gains have been the most volatile, likely reflecting prevalence of incentive and commission pay for those employees. The two occupational groups with the most consistent pay gains relative to the other groups and to inflation have been service occupations (the lowest average wage group) and production, transportation and moving occupations. This suggests some moderation in wage inequality during the last decade.
The recent trend toward declining wage growth is clear for all occupation groups except sales and related workers, whose pay is the most volatile. Nevertheless, wage growth remains above the inflation rate, and almost two percentage points higher than in 2015.
Data Notes: The Employment Cost Index (ECI) is produced by the U.S. Bureau of Labor Statistics to measure trends in the costs of compensation paid by employers to their employees, free from the influence of employment shifts among occupations and industries. The ECI is one of the labor market indicators used by the Federal Reserve Board to monitor the effects of fiscal and monetary policies and is released quarterly with a one-month lag.
Data for the Q2 2025 reference period (the 3-months ending in June 2025) were collected from a probability sample of approximately 26,400 occupational observations selected from a sample of about 6,200 private industry establishments and approximately 7,400 occupational observations selected from a sample of about 1,400 state and local government establishments that provided data at the initial interview.
Link to most recent ECI release: https://www.bls.gov/news.release/eci.nr0.htm.
The Institute for Compensation Studies (ICS) at Cornell University's ILR School is an interdisciplinary center that researches, teaches and communicates about monetary and non-monetary rewards from work, and how these rewards influence outcomes for individuals, companies, industries, and economies. At the crossroads between scholarship and practice, ICS is an exchange dedicated to helping new knowledge hit its mark in the world of work.
Contact:
Erica L. Groshen
Senior Economics Advisor
Institute for Compensation Studies
erica.groshen@cornell.edu
Authors:
Linda Barrington, Cornell SC Johnson College of Business
Seung-Hun Chung, Yale University
Erica L. Groshen, Cornell University – ILR School
The Institute for Compensation Studies