2021 Fourth Quarter
2021 Fourth Quarter: Annual compensation growth accelerates but continues to fall short of inflation; largest increases were in wages and salaries for private-sector workers, particularly for those in service occupations.
Civilian workers’ compensation costs 12-month growth rate of 4.0 percent growth is the highest in 20 years--led by high wage and salary growth in the private sector.
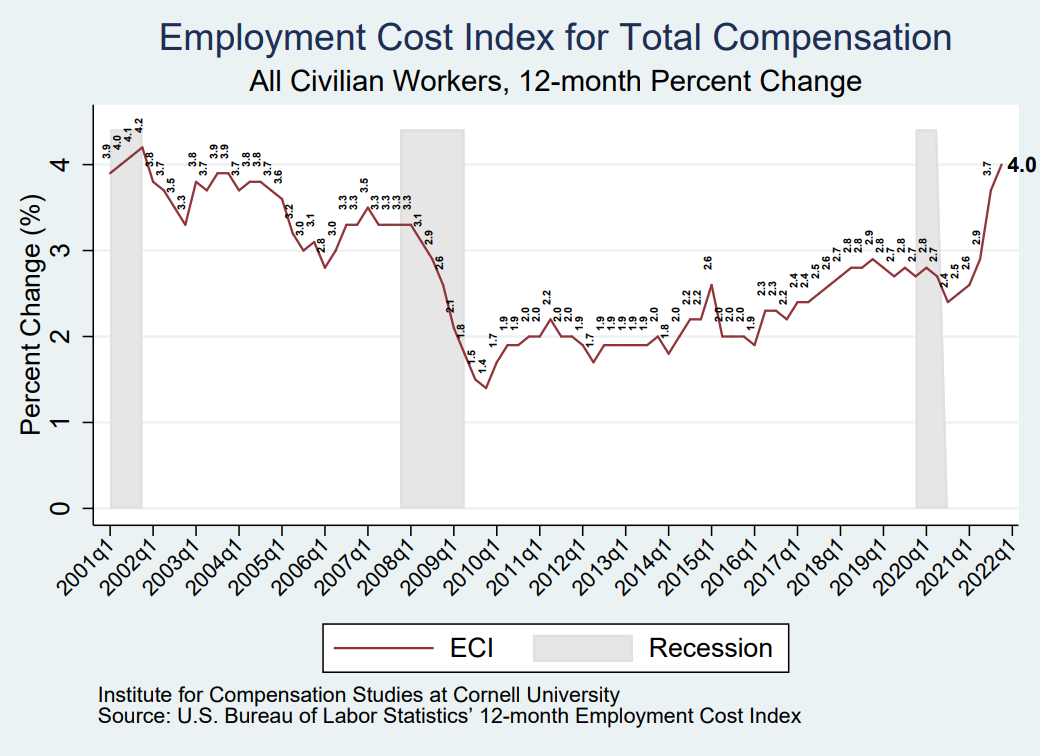
Released January 28, 2022, the U.S. Bureau of Labor Statistics’ 12-month Employment Cost Index (ECI) in the fourth quarter of 2021 rose to 4.0 percent (Chart 1), the highest growth rate since Q4 2001, although it still lagged inflation, which reached 6.7 percent over the same period. Behind this high average trend lies an unusually high degree of variation among occupational groups. In particular, private sector service occupations (whose compensation tends to be very low) have received the highest percentage increases in compensation. By contrast, regional variation is within the normal range.
Chart 1

2021 Q4 12-month ECI growth less than recent inflation and concentrated in the private sector
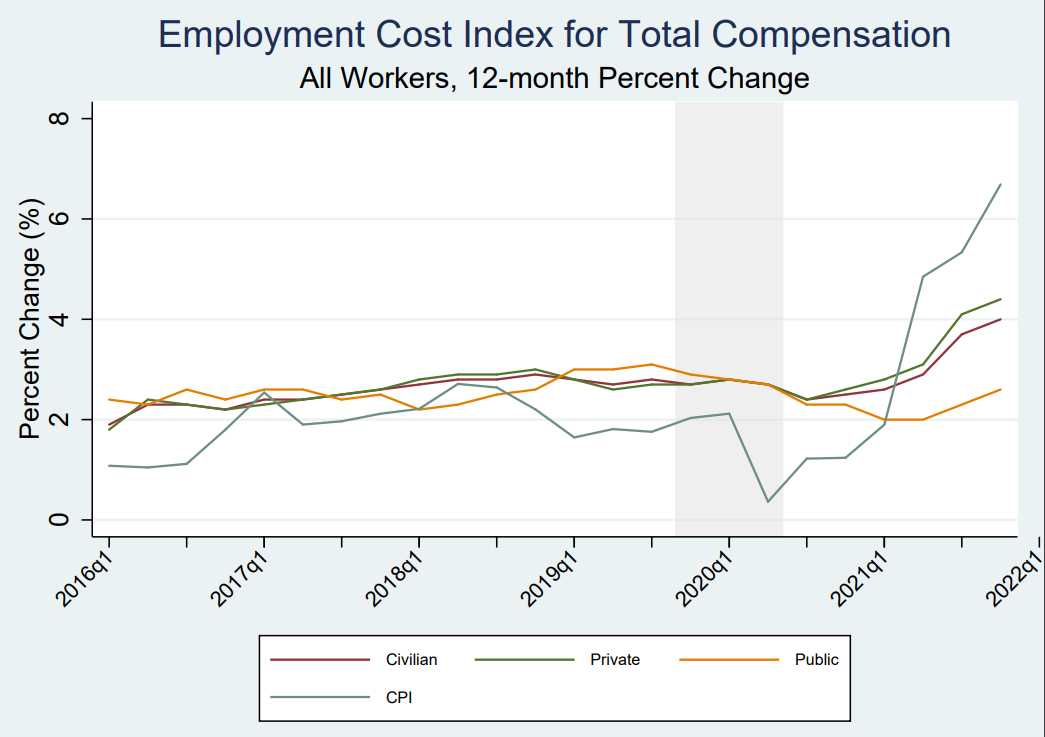
Yet, recent compensation cost increases lag behind inflation. The recent acceleration in compensation increases have been concentrated in the private sector. Government compensation cost growth has been subdued. At the same time, price inflation has been rising. As of Q4 2021, the 12-months rise in consumer prices (6.7 percent) was much higher than private sector compensation costs increases (4.4 percent), especially for government workers (2.6 percent). Thus, workers’ real earnings lost ground, particularly in the public sector.
Chart 2

Shading indicates recessionary periods.
Data sources: U.S. Bureau of Labor Statistics, Employment Cost Index and Consumer Price Index.
Private sector wages and salaries are the fastest-growing component of compensation
Breaking total compensation into its key components of earnings (wages and salaries) and benefits, total benefits typically account for about 30 percent of employer costs for employee total compensation. Table 1 reports the ECI trends for each of these categories by public and private sector. The recent high growth in compensation is primarily due to high wage and salary growth in the private sector.
The table also shows that public sector compensation costs have been slower to accelerate than private sector compensation over the year.
In the private sector, comparing the 12 months ending in December 2020 with the 12 months ending in December 2021, we see a notable pick-up in wage and salary growth (from 2.8 percent to 5.0 percent—the highest growth rate since the series began in Q1 2001). Meanwhile, benefits costs growth also picked up, but by much less (2.1 percent to 2.9 percent).
Public sector compensation grew much more slowly. Recent changes also offset each other. Comparing the 12 months ending in December for 2020 and 2021, wage and salary growth rose from 1.8 percent to 2.7 percent while benefits cost growth slowed from 3.1 percent to 2.5 percent.
Table 1
|
Major series of the Employment Cost Index [Percent change] |
|||||
|
Category |
12-month, not seasonally adjusted |
||||
|
Dec. |
Mar. |
Jun. |
Sep. |
Dec. |
|
|
Civilian workers (1) |
|||||
|
Compensation (2) |
2.5 |
2.6 |
2.9 |
3.7 |
4.0 |
|
Wages and salaries |
2.6 |
2.7 |
3.2 |
4.2 |
4.5* |
|
Benefits |
2.1 |
2.5 |
2.2 |
2.5 |
2.8 |
|
Private industry |
|||||
|
Compensation (2) |
2.6 |
2.8 |
3.1 |
4.1 |
4.4* |
|
Wages and salaries |
2.8 |
3.0 |
3.5 |
4.6 |
5.0* |
|
Benefits |
2.1 |
2.5 |
2.0 |
2.6 |
2.9 |
|
State and local government |
|||||
|
Compensation (2) |
2.3 |
2.0 |
2.0 |
2.3 |
2.6 |
|
Wages and salaries |
1.8 |
1.6 |
1.5 |
2.4 |
2.7 |
|
Benefits |
3.1 |
2.6 |
2.6 |
2.1 |
2.5 |
*Series high (since Q1 2001).
Footnotes
(1) Includes private industry and state and local government.
(2) Includes wages and salaries and benefits.
Prepared by Cornell Institute for Compensation StudiesTM
Data Source: BLS (ECI Historical Listing, January 28, 2022)
Private sector 12-month compensation growth varies widely by occupation
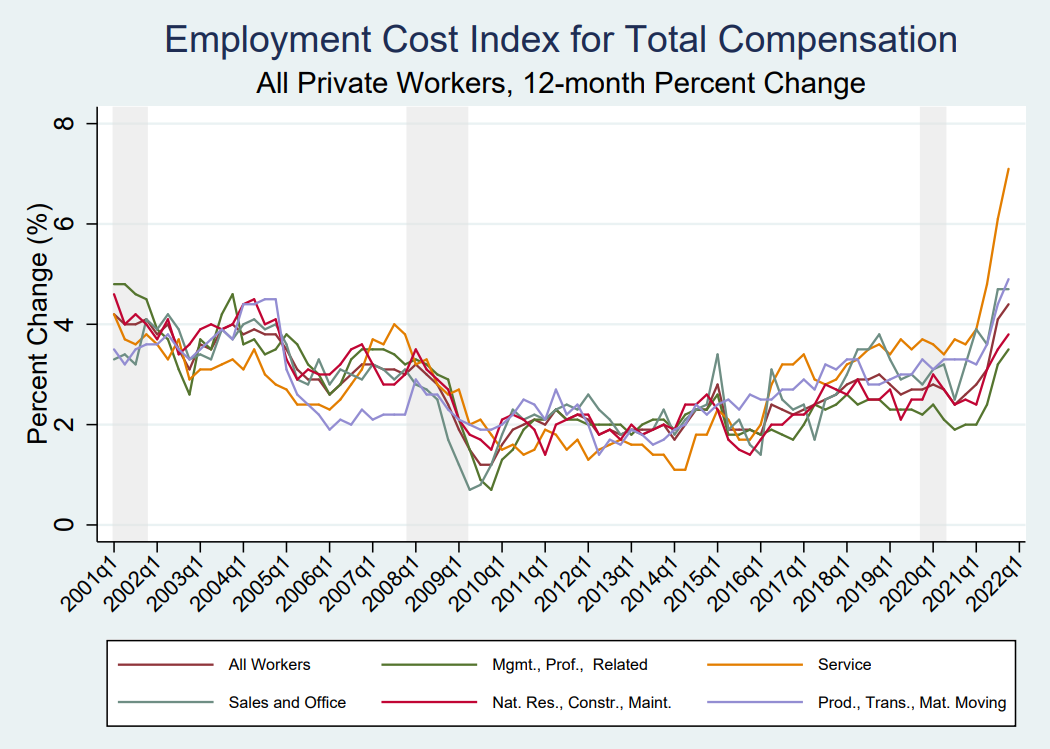
Private sector compensation growth accelerated for all occupational groups (see Chart 3). In addition, growth rates diverged strongly, likely reflecting a high degree of pandemic-related flux in labor supply and demand conditions. Indeed, the standard deviation of growth rates by major occupational group is once again the highest since this series began in 2001 (about triple the median standard deviation). Over the last 12 months, earnings grew slowest (3.5 percent) for professional and managerial occupations (the highest paid occupational group) and twice as fast for service occupations (7.1 percent), the lowest paid group. Indeed, the compensation growth rate for service workers is the highest for any occupational group since the ECI began in Q1 2001. Thus, this pattern suggests at least a temporary pause in the 40+ year trend toward wider US wage inequality.
Chart 3

Shading indicates recessionary periods.
Prepared by Cornell Institute for Compensation StudiesTM
Data Source: US Bureau of Labor Statistics Employment Cost Index
Compensation growth increases across all regions
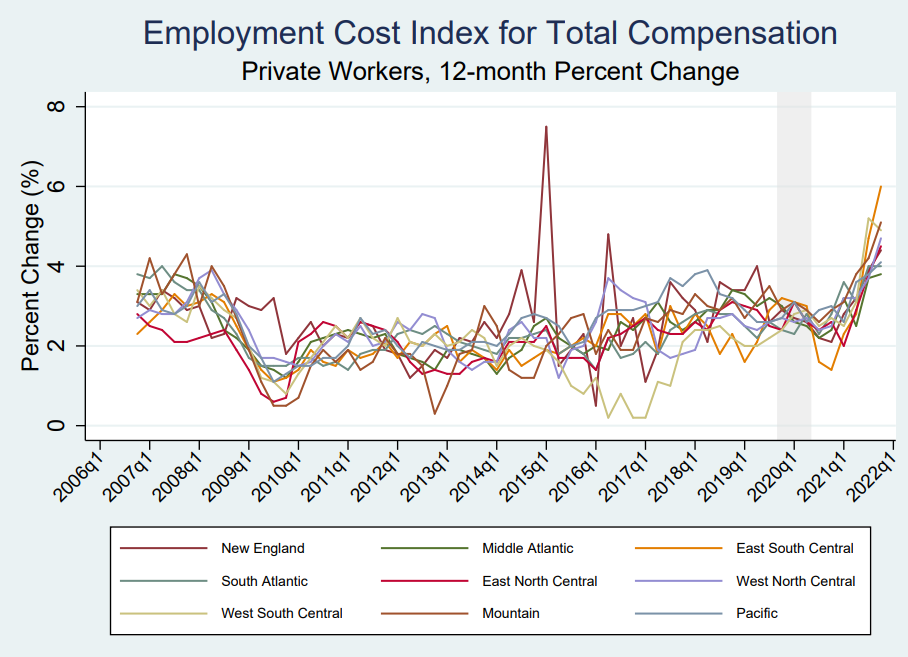
All regions of the country saw rises in 12-month compensation growth (see Chart 4) and all registered their highest rates since series began in 2001. Current compensation changes are moving more uniformly across regions than across occupation; regional changes do not show any unusual variation. At 6.0 percent, growth was strongest in East South Central states while the Mid-Atlantic states experienced the lowest rate at 3.8 percent.
Chart 4

Shading indicates recessionary periods.
The Census divisions are defined as follows: New England: Connecticut, Maine, Massachusetts, New Hampshire, Rhode Island and Vermont; Middle Atlantic: New Jersey, New York, and Pennsylvania; South Atlantic: Delaware, District of Columbia, Florida, Georgia, Maryland, North Carolina, South Carolina, Virginia, and West Virginia; East South Central: Alabama, Kentucky, Mississippi, and Tennessee; West South Central: Arkansas, Louisiana, Oklahoma, and Texas; East North Central: Illinois, Indiana, Michigan, Ohio, and Wisconsin; West North Central: Iowa, Kansas, Minnesota, Missouri, Nebraska, North Dakota, and South Dakota; Mountain: Arizona, Colorado, Idaho, Montana, Nevada, New Mexico, Utah, and Wyoming; and Pacific: Alaska, California, Hawaii, Oregon, and Washington.
Prepared by Cornell Institute for Compensation StudiesTM
Data Source: US Bureau of Labor Statistics Employment Cost Index
The Employment Cost Index (ECI) released January 28, 2022 by the U.S. Bureau of Labor Statistics reflects trends in the costs to employers for the total compensation, wages, and benefits they provide to their workers, controlling for composition of the workforce. The ECI is one of the labor market indicators used by the Federal Reserve Board to monitor the effects of fiscal and monetary policies and is released quarterly. The BLS summary can be found at https://www.bls.gov/news.release/eci.nr0.htm.


