
U.S. Employment Cost Index, Q4 2023 Commentary
2023 Fourth Quarter Summary
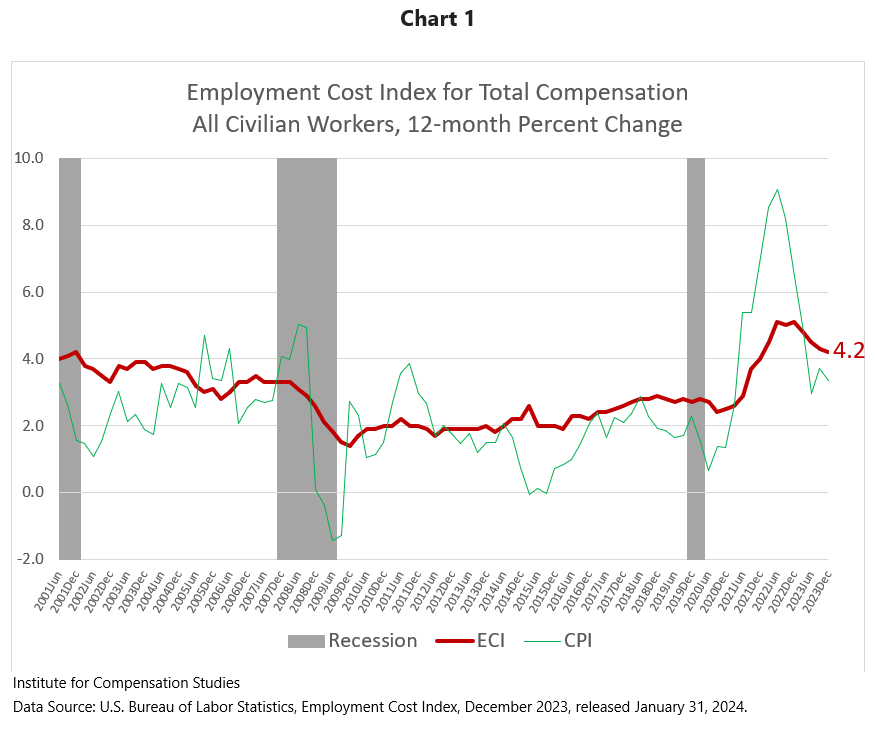
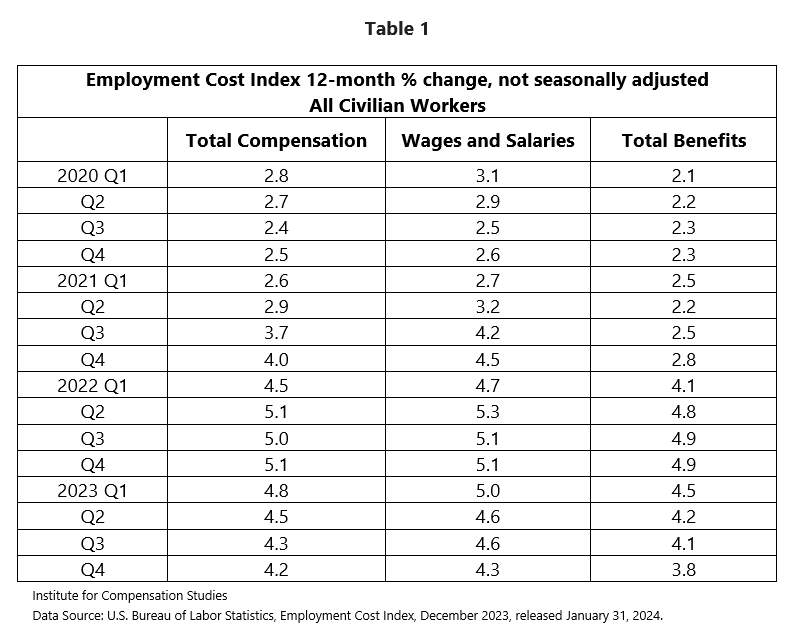
Released on January 31, 2024, the U.S. Bureau of Labor Statistics’ 12-month growth rate of employer costs for employee compensation has exceeded consumer inflation for the third quarter in a row, despite declining to 4.2 percent in Q4 2023 from its 2022 high of 5.1 percent (Chart 1, Table 1). Remaining above the general price inflation experienced by U.S. households (CPI) for three quarters running reflects a solid reversal of the previous eight-quarter period of employee purchasing power erosion.
Growth holding firm in government sector wages and salaries
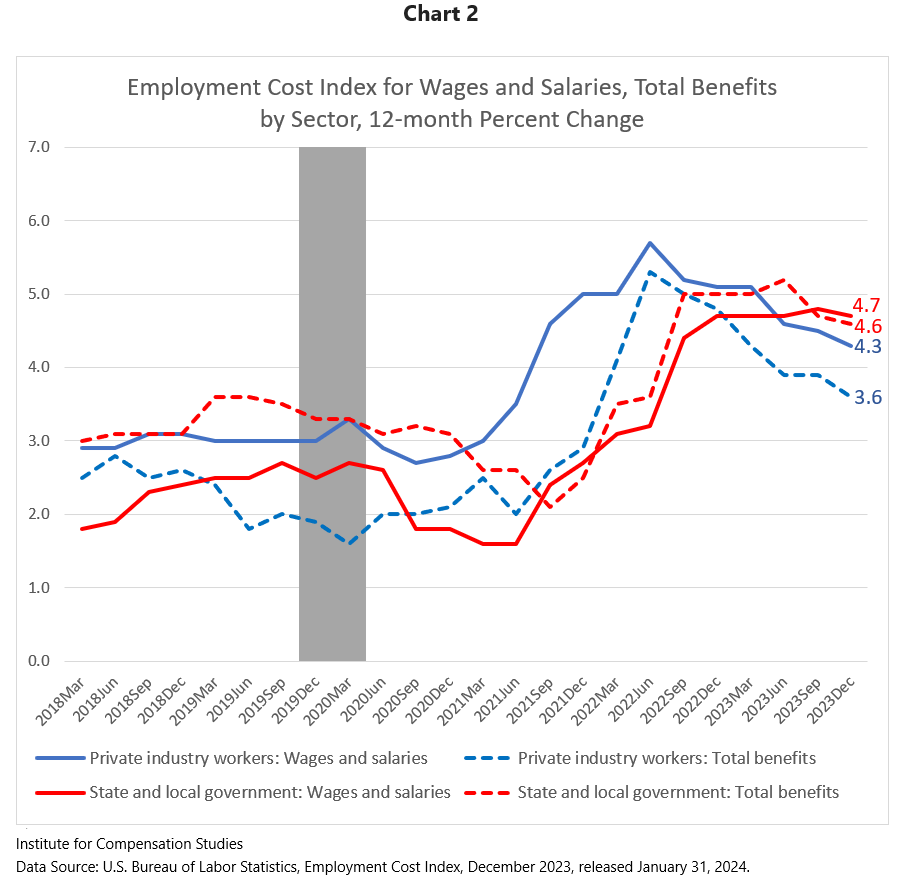
Softening of the overall ECI has been driven by the private sector. The 12-month growth rates of government sector wages and salaries and benefits have exceeded those in the private sector for three quarters. The ECI for government sector wages and salaries has remained essentially flat at 4.7% since December 2022. For private sector employees, the 12-month employment cost index for wages and salaries has declined steadily from its 5.7 percent peak in Q2 (June) 2022, with the ECI for benefits declining even more. It is important to note that the 12-month growth rate of the cost of government employee benefits has demonstrated a second quarter of notable decline. Government sector compensation responds more slowly to economic changes than does private sector compensation. Private sector compensation rose sooner in response to rising inflation beginning in 2021. That growth rate is now falling faster as inflation eases. The softening of benefit cost increases in the government sector may suggest the growth of wages and salaries in the government sector will begin a slowing trend.
Union compensation growth rises above that of non-union workers
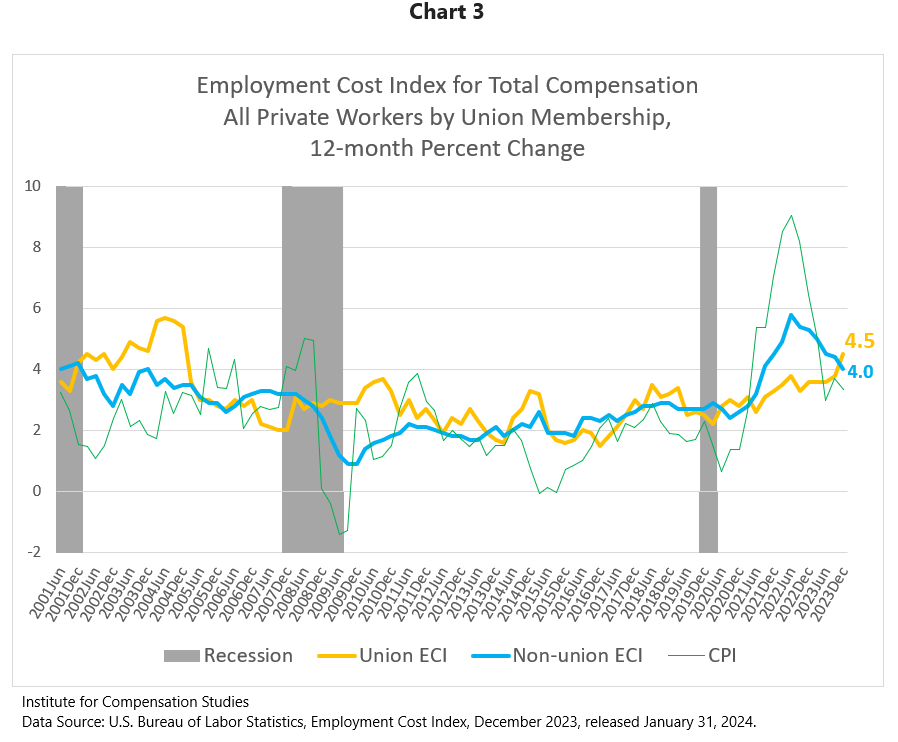
Since its 2021 rapid accent, the non-union 12-month ECI for total compensation had exceeded that for union workers, until this quarter. The annual growth rate of compensation costs for non-union employees continued its downward trend, falling from 4.4 percent in the third quarter of 2023 to 4.0 percent in the fourth quarter (Chart 3). In contrast, the annual growth rate for union compensation jumped from 3.8 percent to 4.5 percent. Without cost-of-living adjustments, multi-year union contracts can slow increases in the employer cost of employee compensation during times of rapid inflation. This quarter’s ECI reveals a catch-up jump for union workers. At a time when growth in non-union worker compensation is falling in tandem with slowing consumer price inflation, the growth rate in union compensation currently exceeds that for non-union workers.
Post-COVID-19 recession, health insurance benefit costs have grown more slowly than inflation and total benefits costs.
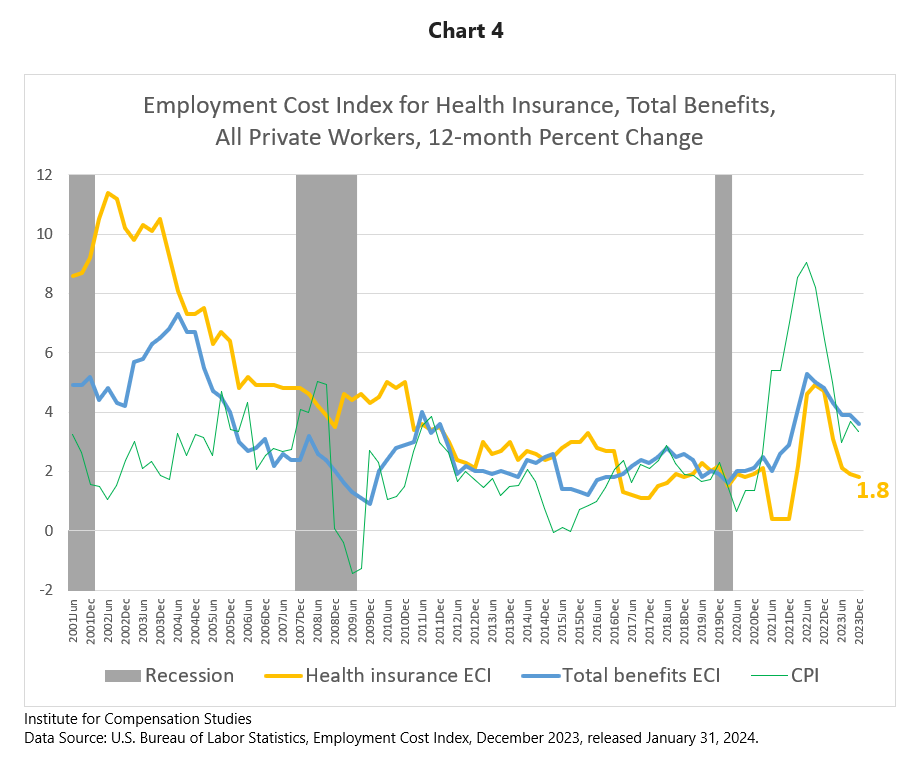
The growth rate in employer costs for employee health insurance benefits has fallen dramatically over the past two decades (Chart 4). And, despite a 2022 spike trending with overall inflation, the 12-month growth rate is back under 2 percent for the second quarter in a row, a number unimaginable in the early 2000s. Since mid-2021, the growth rate of private sector health insurance benefit costs has been consistently lower than the CPI. Prior to 2016, growth rates in employers’ health insurance benefits costs lower than inflation, or overall benefit costs for that matter, were a rarity.
Leisure and Hospitality wage and salary growth rate back to pre-COVID levels
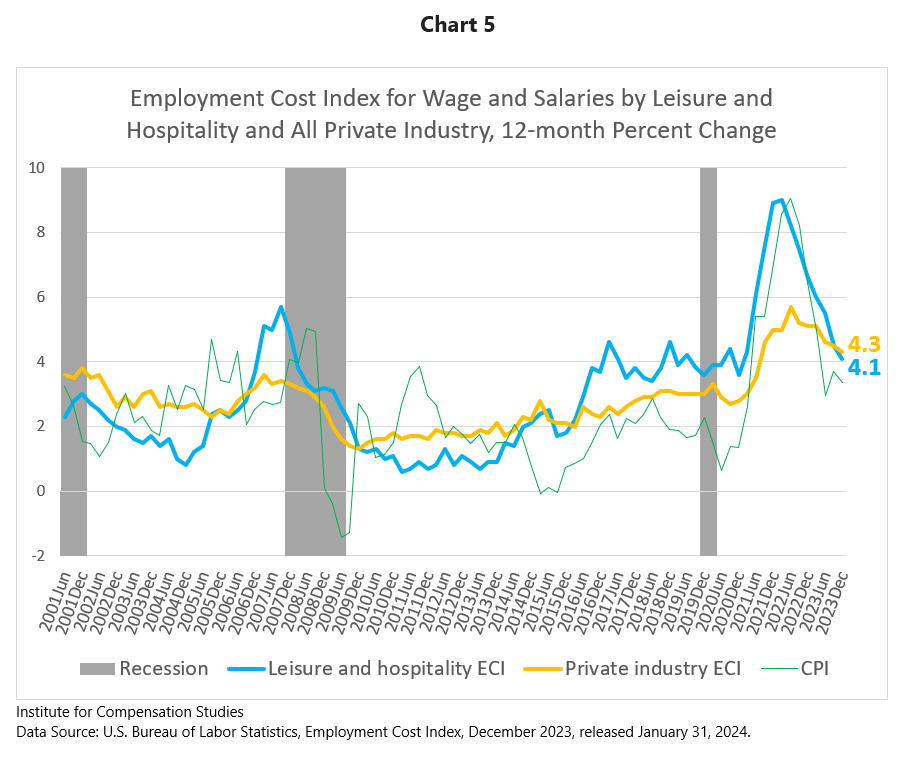
From the end of 2016 until mid-2021, the 12-month ECI for wages and salaries in the Leisure and Hospitality sector hovered just above or below 4 percent (Chart 5). In Q4 2023, the 12-month wage and salary ECI for the Leisure and Hospitality sector was 4.1 percent, returning the sector to this pre-Covid range. This quarter’s 12-month wage and salary ECI for the Leisure and Hospitality sector was also below that for all private industry, despite the tight labor market. From 2001 until just recently, wage and salary growth rates in Leisure and Hospitality that fall below the private sector at large had been associated only with periods of elevated unemployment in the early aftermath of economic recessions.
The Employment Cost Index (ECI) is produced by the U.S. Bureau of Labor Statistics to measure trends in the costs of compensation paid by employers to their employees, controlling for composition of the workforce. The ECI is one of the labor market indicators used by the Federal Reserve Board to monitor the effects of fiscal and monetary policies and is released quarterly with a one-month lag.
Data for the Q4 2023 reference period were collected from a probability sample of approximately 23,600 occupational observations selected from a sample of about 5,600 private industry establishments and approximately 7,500 occupational observations selected from a sample of about 1,400 state and local government establishments that provided data at the initial interview.
Link to most recent ECI release: https://www.bls.gov/news.release/eci.toc.htm.
The Institute for Compensation Studies (ICS) at Cornell University’s ILR School is an interdisciplinary center that researches, teaches and communicates about monetary and non-monetary rewards from work, and how these rewards influence outcomes for individuals, companies, industries, and economies. At thecrossroads between scholarship and practice, ICS is an exchange dedicated to helping new knowledge hit its mark in the world of work.
Contact:
Erica L. Groshen
Senior Economic Advisor
The Institute for Compensation Studies
Authors:
Seung-Hun Chung
Erica L. Groshen
Linda Barrington
The Institute for Compensation Studies


