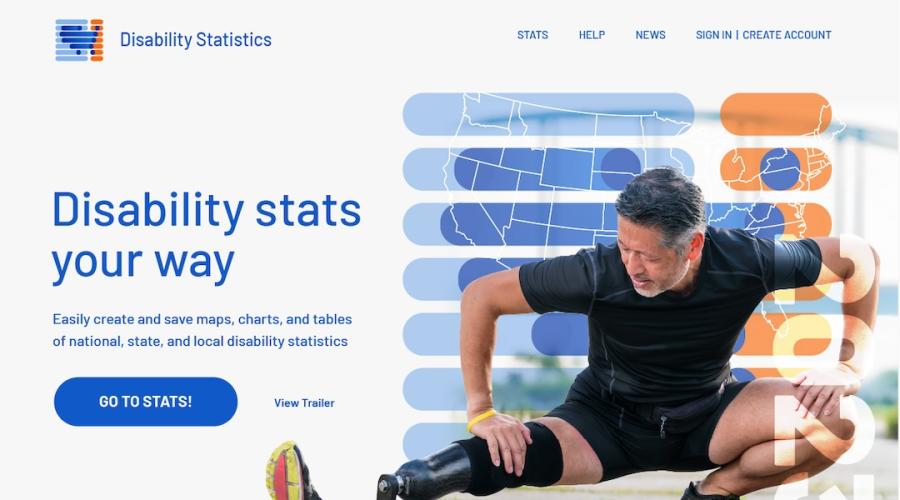
DisabilityStatistics.org Offers Visualization and Local Data
Enhanced geographic specificity and data visualization tools are new features of the revamped DisabilityStatistics.org website that is planned for launch on Feb. 25.
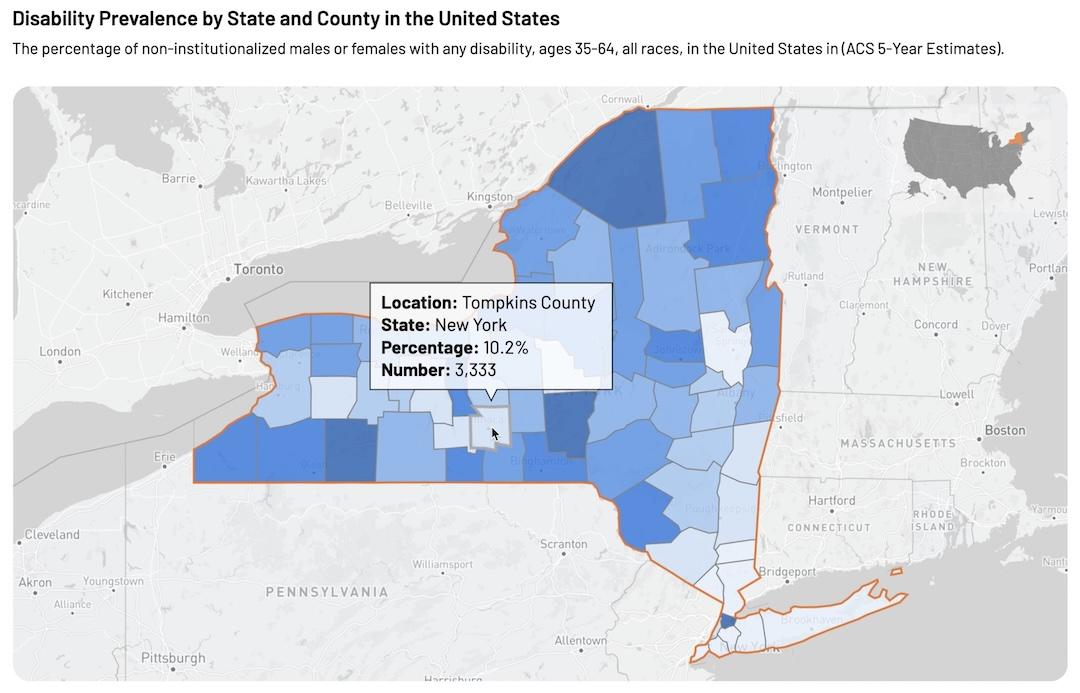
Users will be able to find statistics by state, county and congressional district, allowing for comparison within states and across the nation. For instance, data on the prevalence of disability in each county and congressional district in New York state will be easily accessible. In addition, the site will provide disability estimates across a dozen topics, ranging from employment and working characteristics to veterans and poverty rates.
DisabilityStatistics.org provides data from the U.S. Census Bureau, but instead of republishing huge tables of raw data, the site provides maps, charts, and focused tables. This data is prepared in part by Senior Research Specialist Bill Erickson at the Yang-Tan Institute on Employment and Disability.
The institute’s designers and developers have collaborated with Erickson to create features with policymakers and disability service providers in mind. “We conducted interviews and user testing with U.S. Senate and other congressional staffers, as well as state disability program managers working in the area of disability policy,” said Camille Lee, lead developer of the site and manager of web and image at the institute. “They told us about the types of data, maps, and comparison charts they prefer,” Lee said.
“We provide estimates via charts, maps, tables and summary text that can be copied or downloaded for use in reports and presentations. Our goal is to help individuals spend less time searching for data and more time doing work our communities need.”—Camille Lee
Charts comparing up to seven user-selected geographies can be generated.
The site’s development team is working with members of the disability community to ensure that the site is easy to use and offers rich accessibility features.
Site Launch Webinar
On Feb. 26, Erickson and Lee will give a webinar-based presentation, “Launching the new DisabilityStatistics.org: Get the latest ACS disability estimates with new tools.” The webinar will cover details about site data and how to use the new mapping and charting tools. New! Now you can view the recorded webinar.
Change Begins at the Local Level
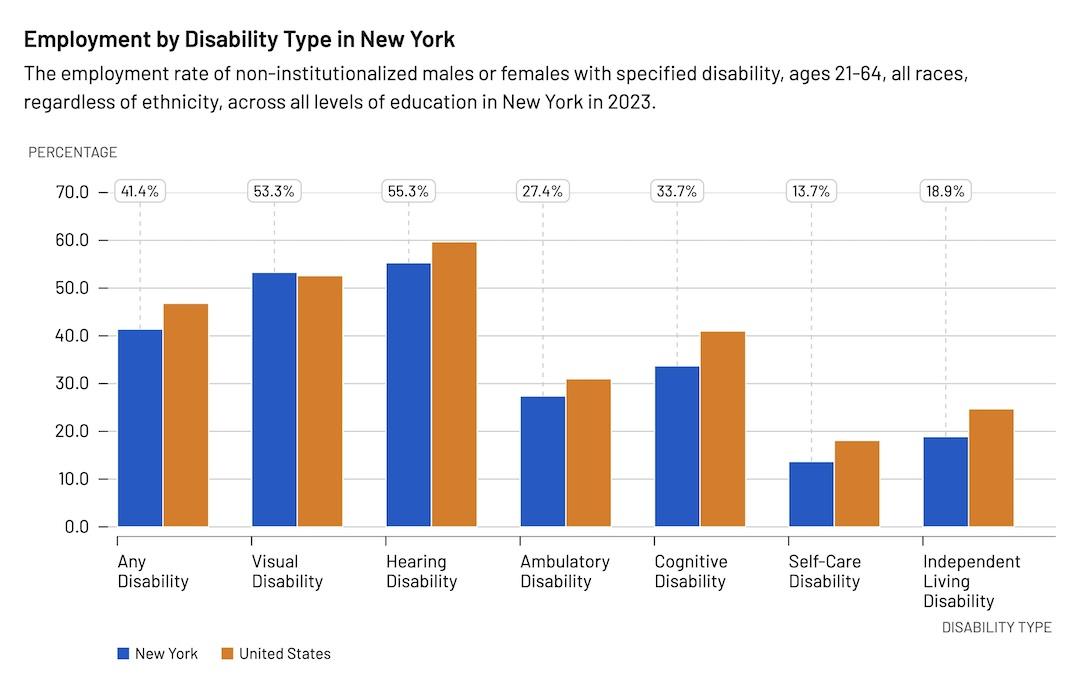
The U.S. Census Bureau’s 2023 American Community Survey has a sample size of two million households, totaling approximately 4.7 million people. On DisabilityStatistics.org, behind-the-scenes work that has been done makes it easy to learn that in 2023, working-age people (ages 21–64) with disabilities nationally were employed at a lower rate (46.8%) than people without disabilities (81.5%).
It’s also possible to compare employment rates at the state, county and congressional district levels. “In relaunching DisabilityStatistics.org, one of our goals is to help employers understand their local applicant pool more fully,” said Wendy Strobel Gower, director of the Northeast ADA Center and Thomas P. Golden executive director of the Yang-Tan Institute. “Looking at statistics around disability and demographic data like unemployment and education makes it possible to plan programs and track progress,” Strobel Gower said.
“Disability estimates are often discussed at the national level, but change also begins locally. Accessing local data is essential for policymakers, administrators, and advocates. It allows them to plan programs, assess impact, and request funding from local governments and other funders.” –Wendy Strobel Gower
The relaunch of DisabilityStatistics.org is supported by the Northeast ADA Center, a program housed in the Yang-Tan Institute.
Data Has Many Uses
Data from the new site can be used for various purposes. In the past, Erickson has received email messages from people who wanted local disability information for projects like testing new prescription drug labels aimed at the visually impaired and writing a business plan to sell voice-controlled automation systems to people in New York state with ambulatory disabilities.
Two Data Sources
To include a wide variety of topics as well as local-level estimates, DisabilityStatistics.org uses data from two sources. Both sources are based on the U.S. Census Bureau’s American Community Survey.
One source provides customized estimates, many of which are not available in Census Bureau tables. Erickson generates the data, based on the Census Bureau’s Public Use Microdata Sample (PUMS), using high-powered computing services at the Cornell Center for Social Sciences. The resulting 3.2 million-row data table is imported into a cloud database that is queried by DisabilityStatistics.org. The prevalence and employment estimates from 2008–2023 can be disaggregated by demographic characteristics, including disability status, disability type, age, sex, race and educational attainment, at the national and state level. Other topics focusing on the working-age population (ages 21–64) include poverty, educational attainment, and veteran service-connected disability, as well as earnings by disability status and type.
A second source provides estimates for more local areas, including congressional districts and counties, with plans to add municipalities. This source, based on five-year estimates from the Census Bureau, has more limited topics and disaggregation options than the custom estimates.
“While the reasons for the separation of the site’s disability estimates into two sources can be headache-inducing, the resulting breadth of accessible data is hopefully clear,” Lee said.
“DisabilityStatistics.org provides an extremely wide range of disability estimates with disaggregation options that are difficult to find or do not exist elsewhere on the internet.” —Camille Lee
About the Yang-Tan Institute
Providing practical information to policymakers, educators, employment specialists and others who assist people with disabilities is a core focus for the Yang-Tan Institute on Employment and Disability, which is part of Cornell’s ILR School. The institute’s mission is to advance knowledge, policies and practices that enhance equal opportunities for all people with disabilities. Its research, training and technical resources expand knowledge about disability inclusion, leading to positive change.
The institute leads many grant-funded projects, including the Northeast ADA Center and New York state’s Subminimum Wage to Competitive Integrated Employment (SWTCIE). The institute also receives funding via a New York state legislative appropriation to assist with a variety of disability-related initiatives.